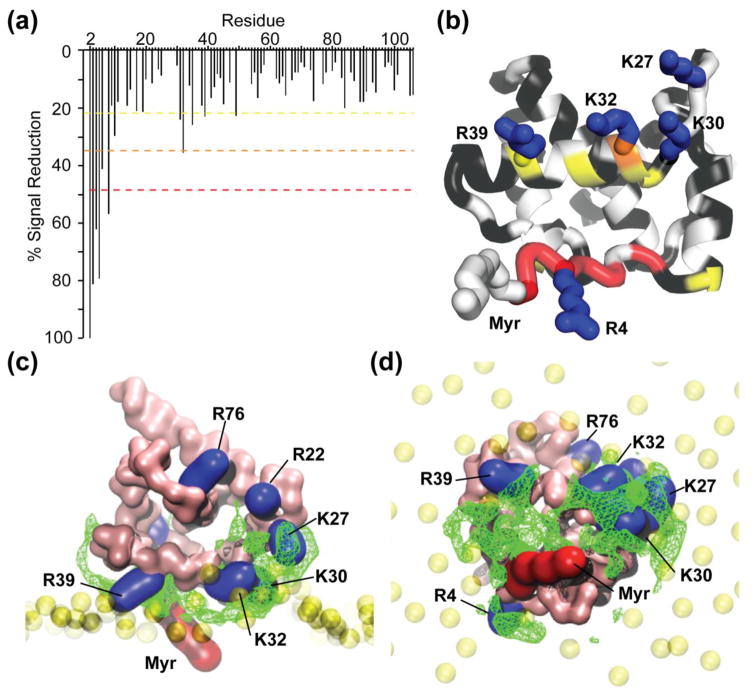
Figure 9.
NMR and MD simulation data support a revised membrane-binding model. (a) Histogram displaying the loss of amide signal intensities in the HSQC spectra caused by addition of 5-DOXYL-PC to 15N labeled MA in the presence of PI(4,5)P2 containing bicelles. Colors correspond to 1 (yellow), 2 (orange), and 3 (red) standard deviations from the mean noise (below 20%). (b) Ribbon representation of MA highlighting the residues that exhibit significant 5-DOXYL-PC-dependent signal reduction (colors correspond to the dashed lines in panel a; black denotes no signal loss; white denotes not quantitatively measured due to signal overlap. (c and d) Side (c) and bottom (d) views of a representative MA:bilayer structure generated during the course of the CG simulations. The green mesh represents the most statistically occupied regions over time by the PI(4,5)P2 along the MD simulation (>70% of the total simulation duration). Basic residues that exhibit either 5-DOXYL-PC-dependent signal reduction or perturbation upon titration of PI(4,5)P2 in bicelles are represented in blue.

