Figure 1.
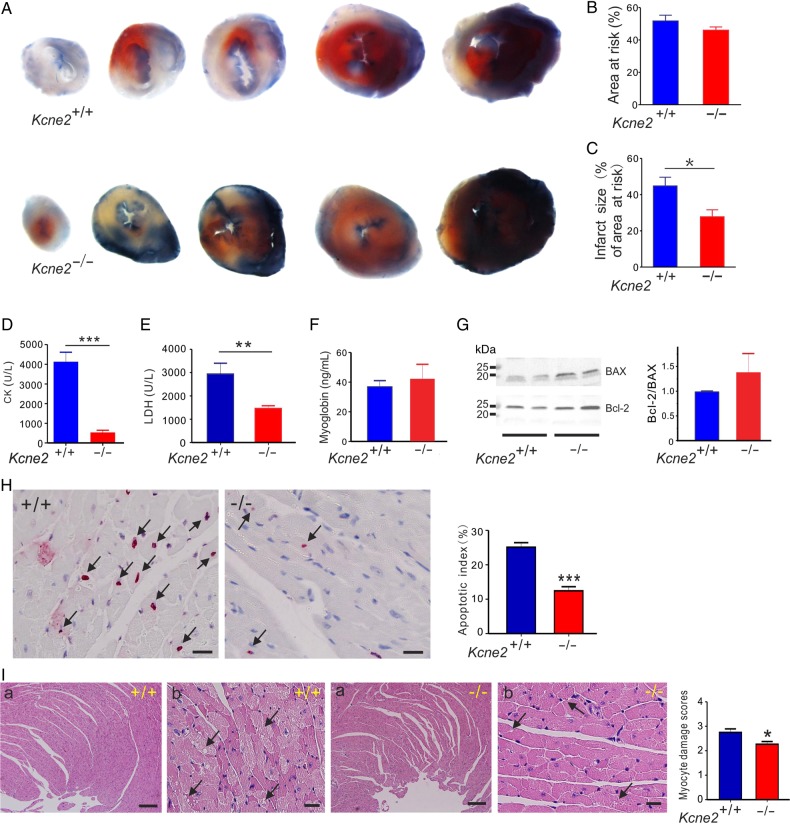
Kcne2 deletion decreases infarct size and cardiac damage after experimentally imposed IRI. (A) Representative photographs of Evans blue-perfused, TTC-stained heart sections obtained from Kcne2+/+ and Kcne2−/− mice. Red, AAR; blue, healthy viable tissue; white, infarcted tissue. (B) Mean AAR after IRI expressed as a percentage of LV area in Kcne2+/+ and Kcne2−/− mice. (n = 5–6 per group). (C) Mean myocardial infarct size after IRI expressed as a percentage of the LV AAR in Kcne2+/+ and Kcne2−/− mice (n = 5–6 per group). *P < 0.05 between genotypes. (D) Post-IRI mean serum levels of CK of Kcne2+/+ and Kcne2−/− mice (n = 10–11). ***P < 0.001 between genotypes. (E) Post-IRI mean serum levels of LDH of Kcne2+/+ and Kcne2−/− mice (n = 12). **P < 0.01 between genotypes. (F) Post-IRI mean serum levels of myoglobin of Kcne2+/+ and Kcne2−/− mice (n = 7–8). (G) Left: representative western blots showing post-IRI ventricular BAX and Bcl-2 expression, one mouse per lane. Right: mean band density from blots as in left, n = 6–7. (H) Left: representative TUNEL-stained heart sections of mice subjected to 45 min of myocardial ischaemia and 3 h of reperfusion injury. Arrows indicate TUNEL-positive cardiomyocytes (red). Scale bars, 10 µm. Right: graph showing the averaged percentage of TUNEL-positive cells in the ischaemic regions of LVs (n = 4–5, each genotype). ***P < 0.001 between genotypes. (I) Left: representative histological H&E-stained micrographs of cardiac section including the ischaemic and the non-ischaemic areas of the LV tissue from Kcne2+/+ and Kcne2−/− mice as indicated, representative of n = 4–6 mice per genotype. Arrows point at either myocyte cytoplasmic vacuolation, oedema, haemorrhage, or steatosis. Panel (a) scale bars: 100 µm; panel (b) scale bars, 10 µm. Right: morphological evaluation of myocardium damage after reperfusion in ischaemic left ventricles of both genotypes (n = 4–6 mice per genotype). The type and severity of myocardial lesions were graded from 0 to 3 (see the ‘Methods’ section). *P < 0.05 between genotypes.

