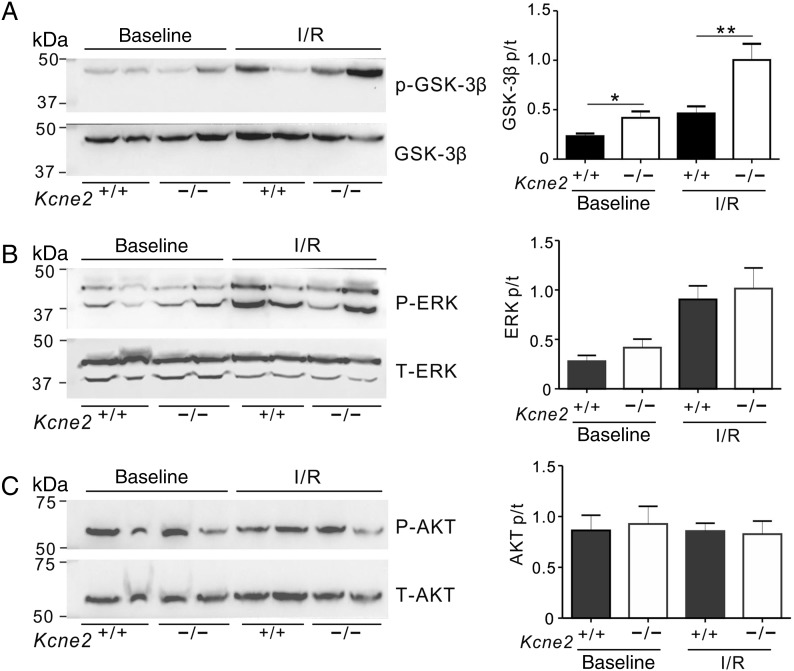
Figure 4.
Kcne2 deletion increases ventricular GSK-3β phosphorylation. (A) Left: representative western blots showing baseline and post-IRI ventricular phospho- (p-) GSK-3β and total (t) GSK-3β expression, one mouse per lane. Right: mean ratio of pGSK-3β/tGSK-3β band density from blots as in left; n = 4–6; *P < 0.05, **P < 0.01 between genotypes. (B) Left: representative western blots showing baseline and post-IRI ventricular phospho- (p-) ERK1/2 and total (t) ERK1/2 expression, one mouse per lane. Right: mean ratio of pERK/tERK band density from blots as in left; n = 4–6. (C) Left: representative western blots showing baseline and post-IRI ventricular phospho- (p-) AKT and total (t) AKT expression, one mouse per lane. Right: mean ratio of pAKT/tAKT band density from blots as in left; n = 4–6.

