Figure 1.
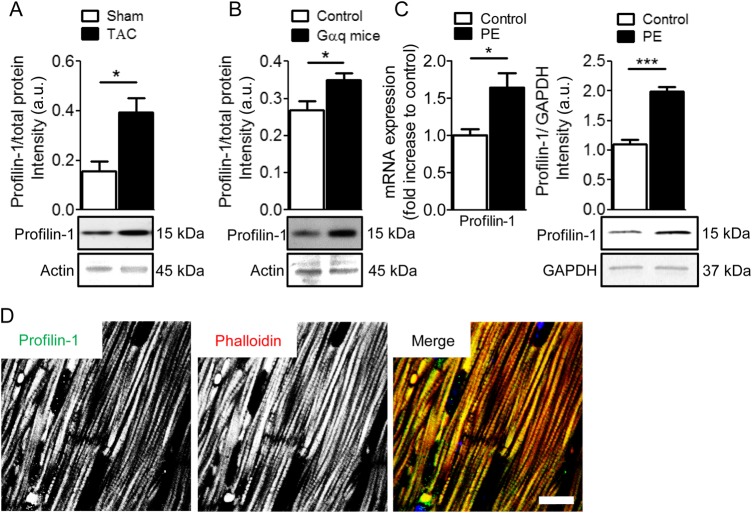
Increased expression of profilin-1 in hypertrophic cardiomyocytes. (A) Pressure-overload following TAC resulted in elevated levels of profilin-1 in mouse hearts. Protein levels were corrected for total gel loading (see Supplementary material online, Figure S1A). Representative actin bands from Direct Blue 71-stained membranes are shown. A significant increase in profilin-1/total protein was observed in the myocardium of the TAC vs. Sham group (n = 5–10, *P < 0.05; Student's t-test). (B) A hypertrophic/HF mouse model overexpressing wild-type Gαq showed higher levels of cardiac profilin-1 compared with control (n = 3–7, *P < 0.05; Student's t-test). Protein levels were corrected for total gel loading (see Supplementary material online, Figure S1A). Representative actin bands from Direct Blue 71-stained membranes are shown. (C) PE treatment in NRVMs increased Pfn1 mRNA (n = 6, *P < 0.05; Student's t-test) and profilin-1 (n = 6, ***P < 0.001; Student's t-test) content. (D) Representative confocal images of control murine cardiac tissue show profilin-1 repetitively associates with myofibrils in a striated manner. Scale bar, 10 μm.

