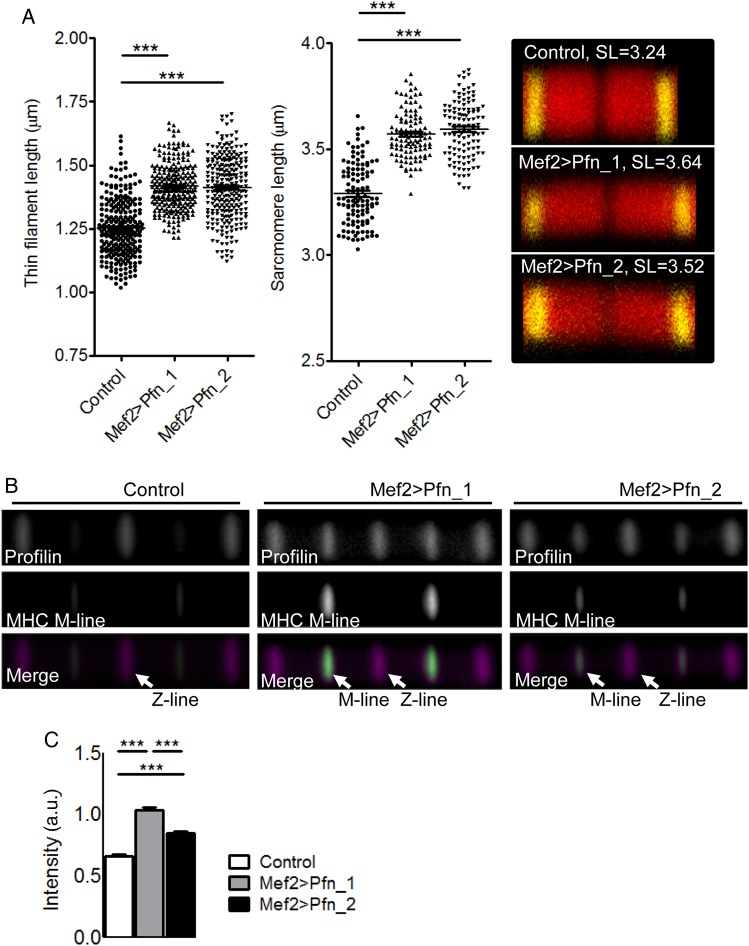
Figure 4.
Elongated thin filaments and sarcomeres in flies overexpressing profilin. (A) Left: increased IFM thin filament (n = 252–255, ***P < 0.001; one-way ANOVA with the Bonferroni post hoc test) and sarcomere lengths (n = 106–116, ***P < 0.001; one-way ANOVA with the Bonferroni post hoc test) were measured in flies with Mef2-GAL4-driven profilin overexpression. Right: typical IFM sarcomeres for control and profilin-overexpressing flies (red, TRITC-phalloidin-stained thin filaments; yellow, anti-α-actinin-stained Z-lines). (B) Averaged composite images of consecutive IFM sarcomeres from flies with elevated profilin levels revealed localization at the Z-line and at the thin filament pointed end/H-zone, whereas controls predominantly showed profilin localization at the Z-line. The M-line/H-zone was labelled using an MHC antibody that recognizes the centre of thick filaments along IFM myofibrils. (C) Based on normalized fluorescence intensity, Mef2 > Pfn_1 and Mef2 > Pfn_2 transgenic flies had significantly more profilin at the M-lines/H-zones, proximal to the thin filament pointed ends, relative to that at the Z-lines compared with controls (n = 123–143, ***P < 0.001; one-way ANOVA with the Bonferroni post hoc test).

