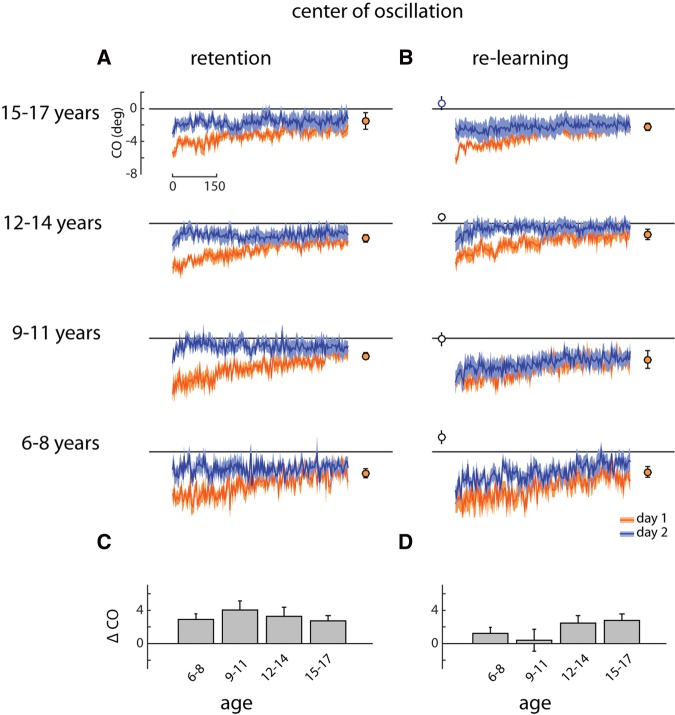
Figure 5.
(A) Retention group: symmetry in center of oscillation (CO) across 600 strides of the split-belt conditions on day 1 (orange) and day 2 (blue) overlaid. Solid lines with shaded area are mean ± SE. Closed symbols show final (last 20 strides) center of oscillation symmetry for day 1 learning. (B) Re-learning group data plotted as in A. Open symbols show center of oscillation symmetry prior to re-learning (last 20 strides of washout). (C) Difference across days (day 2—day 1) in center of oscillation symmetry during early adaptation (first 20 strides of split-belt walking) for the Retention group. (D) Difference in symmetry for the Re-learning group plotted as in C.

