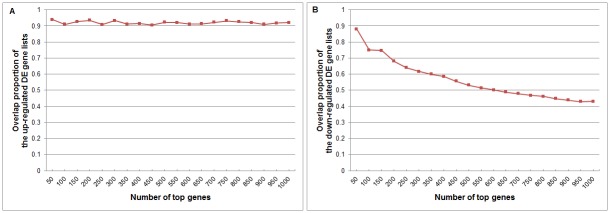
Fig 2. Overlap proportions of differentially expressed genes detected by fold-change from the data with corrected and uncorrected global shift effects on Loven et al’s data.
(A) Up-regulated DE genes. (B) Down-regulated DE genes. The x-axis is the number of the top genes of the up-regulated DE gene lists or the down-regulated DE gene lists. The y-axis is the overlap proportions of the top genes.

