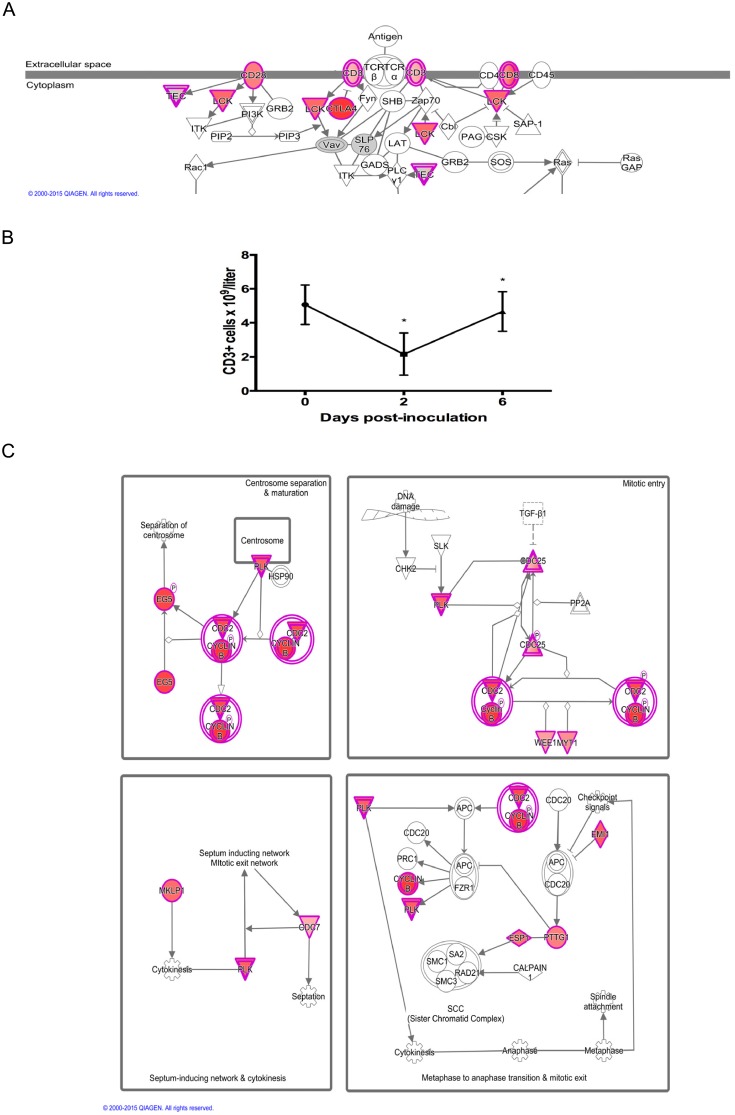
Fig 3. Relationship between T Cell and Mitosis Gene Expression Six Days Post-inoculation with PRRSV.
(A) T cell receptor signaling pathway from Ingenuity Pathway Analysis showing genes that are upregulated (red) on D6 compared to D2 in whole blood of PRRSV-inoculated gilts. Color intensity indicates magnitude of differential expression. (B) Plot of mean T cell (CD3+ve) number for the 16 experimental gilts during the first six days of infection showing the rebound in T cell numbers between day 2 and day 6 post-infection. Cell counts were obtained from a previously published dataset [10]. Asterisks indicate significant cell count differences between successive time-points (P<0.001). (C) Mitosis signaling pathways from Ingenuity Pathway Analysis showing genes that are upregulated (red) on D6 compared to D2. Color intensity indicates magnitude of differential expression. The data suggest that mitosis is at least partly responsible for the rebound in T cell numbers between D2 and D6 post-inoculation.

