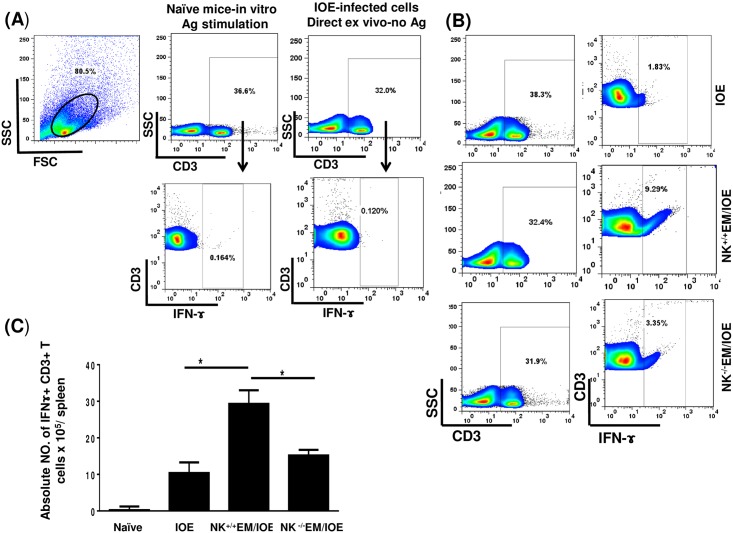
Fig 7. Decreased percentage of IFN-γ producing CD3+ T cells in NK-/-EM/IOE-mice.
Splenocytes were harvested from the indicated mice groups on day 7 after IOE infection, and were stimulated in vitro with E. muris Ags or left unstimulated. Lymphocytes were gated based on the forward and side scatter, and then cells were gated on CD3. CD3+ T cells were further analyzed for intracellular IFN-γ staining as shown in the gating strategy (A). Controls shown in dot plots includes naïve splenocytes stimulated in vitro with E. muris Ags and IFN-γ production by unstimulated splenocytes from IOE-infected mice. (B) Dot plots shows the percentage of gated CD3+ T cells and the percentage of IFN-γ+ CD3+ T cell subset in indicated mice groups following in vitro stimulation with E. muris Ags. (C) Data show the differences in the absolute number of IFN-γ+ CD3+ T cells in the spleen of indicated mice groups. Data shown are from three mice/groups with similar results in three independent experiments (n = 9 mice/group).

