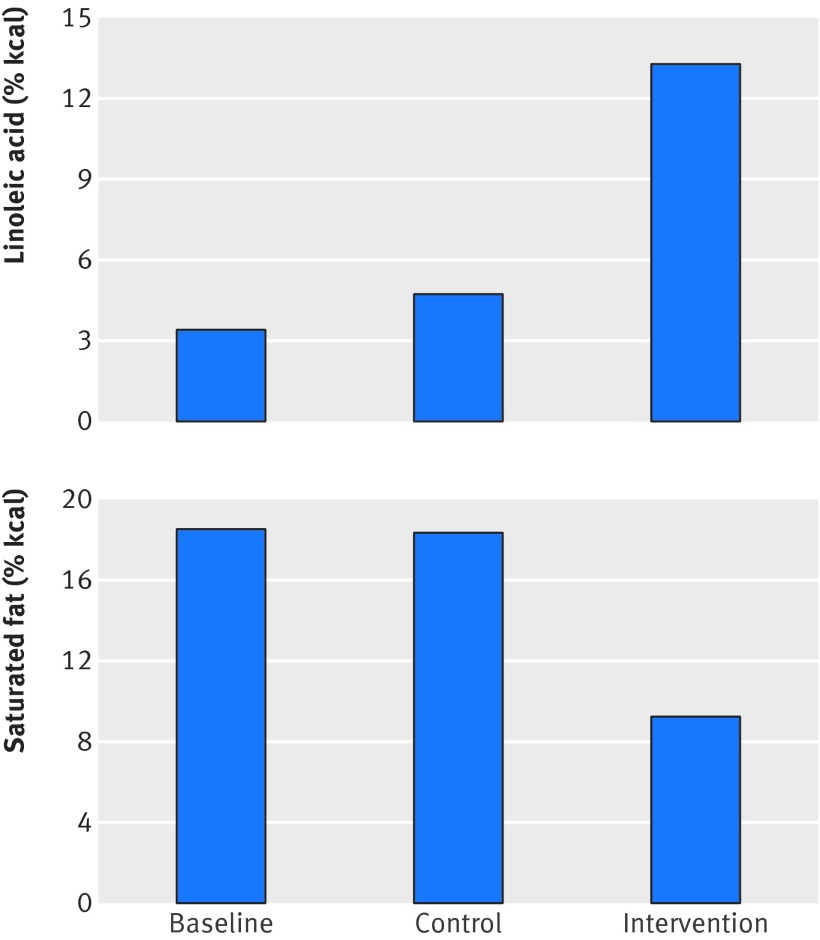
Fig 3 Linoleic acid and saturated fat compositions of MCE control and intervention group diets. Values in figure are based on chemical analysis of study foods.16 Intervention group reduced saturated fat intake by about 50% and increased linoleic acid intake by >280%. Control group maintained high saturated fat intake but increased linoleic acid intake by about 38%. Based on Keys equation, these diet changes are predicted to lower cholesterol in both groups (table 2)

An official website of the United States government
Here's how you know
Official websites use .gov
A
.gov website belongs to an official
government organization in the United States.
Secure .gov websites use HTTPS
A lock (
) or https:// means you've safely
connected to the .gov website. Share sensitive
information only on official, secure websites.
