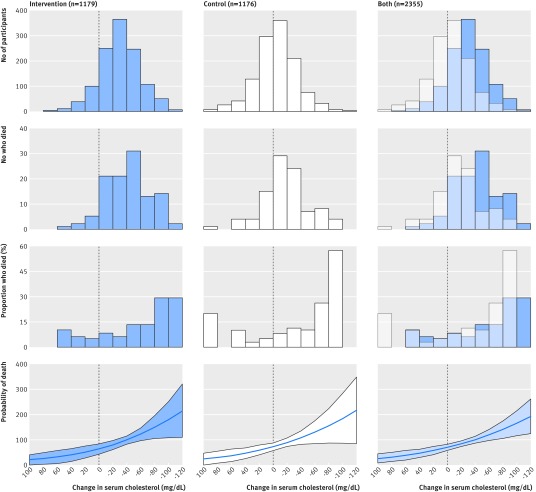
Fig 6 Death from any cause and change in serum cholesterol in cohort that received diets for one year or more (n=2355). Panels indicate relations between change in serum cholesterol and number of participants, number of deaths, percent of deaths, and probability of death among intervention, control, and combined groups. Change in serum cholesterol calculated with average of measurements before and after randomization for each individual. Last row represents logistic model for death as function of average change in cholesterol, adjusted for age at baseline. Likelihood ratio test used to test effect modification by diet group (P=0.67)

An official website of the United States government
Here's how you know
Official websites use .gov
A
.gov website belongs to an official
government organization in the United States.
Secure .gov websites use HTTPS
A lock (
) or https:// means you've safely
connected to the .gov website. Share sensitive
information only on official, secure websites.
