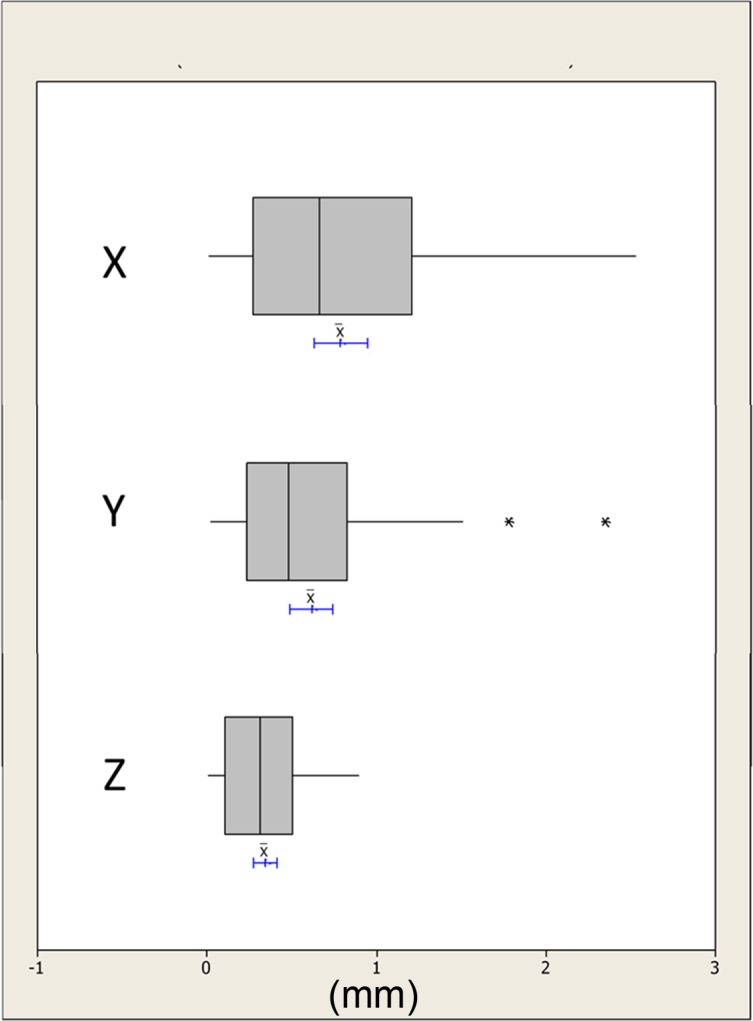
Fig 5. Boxplots showing the median, interquartile range (grey box) and outliers (*) for the x, y and z distances between all the simulated mandibular surgical movements i.e. left, right and protrusion and the measurements based on the conformed mesh chin region.

The blue lines indicate the 95% confidence intervals for the mean differences.
