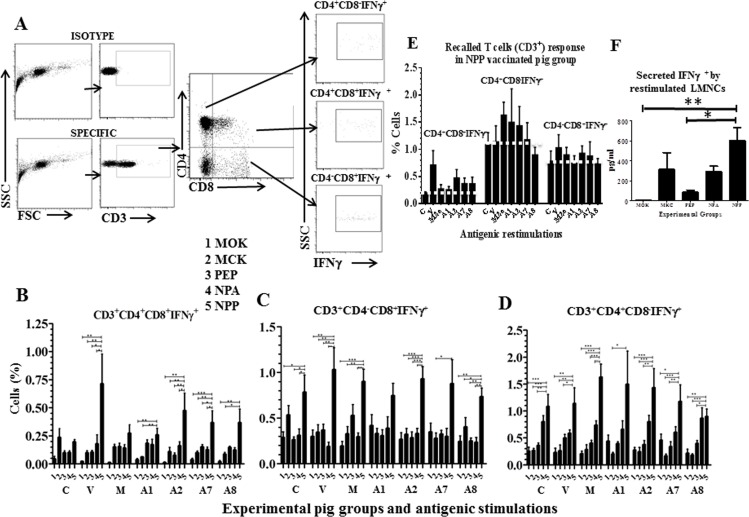
Fig 2. Immunophenotyping of activated lymphocyte subsets in LMNCs of vaccinated and SwIV challenged pigs.
(A) A representative flow cytometry plots depicting porcine IFNγ positive T lymphocytes subpopulations. Gating pattern of lymphocytes of a pig infected with SwIV H1N1 and restimulated ex vivo with the virus for 3 days and immunostained using fluorochrome conjugated pig specific CD3έ, CD4α and CD8α markers and intracellular IFNγ to identify the frequency of CD3+CD4+CD8α+IFNγ+, CD3+CD4-CD8α+IFNγ+ and CD3+CD4+CD8α-IFNγ+ cells is shown. Lung MNCs (LMNCs) isolated on the day of necropsy from all the experimental pigs were either unstimulated (Control, C) or stimulated with the SwIV (V), conserved peptides (A1, A2, A7 and A8 peptides) or M2e (M) for 3 days and immunostained cells were gated for T cell subsets as described above for: (B) CD3+CD4+CD8α+IFNγ+; (C) CD3+CD4-CD8α+IFNγ+; and (D) CD3+CD4+CD8α-IFNγ+ cells. (E) Delineating the SwIV specific T cell response in NPP vaccinated pigs. Three activated (IFNγ+) T lymphocyte subsets in the LMNCs of only NPP vaccinated pigs either unstimulated (Control, C) or stimulated with the SwIV or indicated peptides are shown. A white dotted line drawn across each T cell subset separates the Ags specific recalled T cell response over the control unstimulated cells of NPP vaccinated pigs. (F) Secreted IFNγ in the culture supernatant of virus restimulated LMNCs of vaccinated and SwIV challenged pigs was analyzed by ELISA. Background cytokine levels from each pig groups were subtracted from the specific stimulation. Each bar indicates the average frequency of indicated T cell subset or cytokine from 6 or 7 pigs ± SEM. Asterisk denotes statistically significant difference at P<0.05 (*), P<0.01 (**) and P<0.001 (***) between the indicated two pig groups determined by One way ANOVA followed by Tukey Post-hoc test for the significance between the indicated pig groups.

