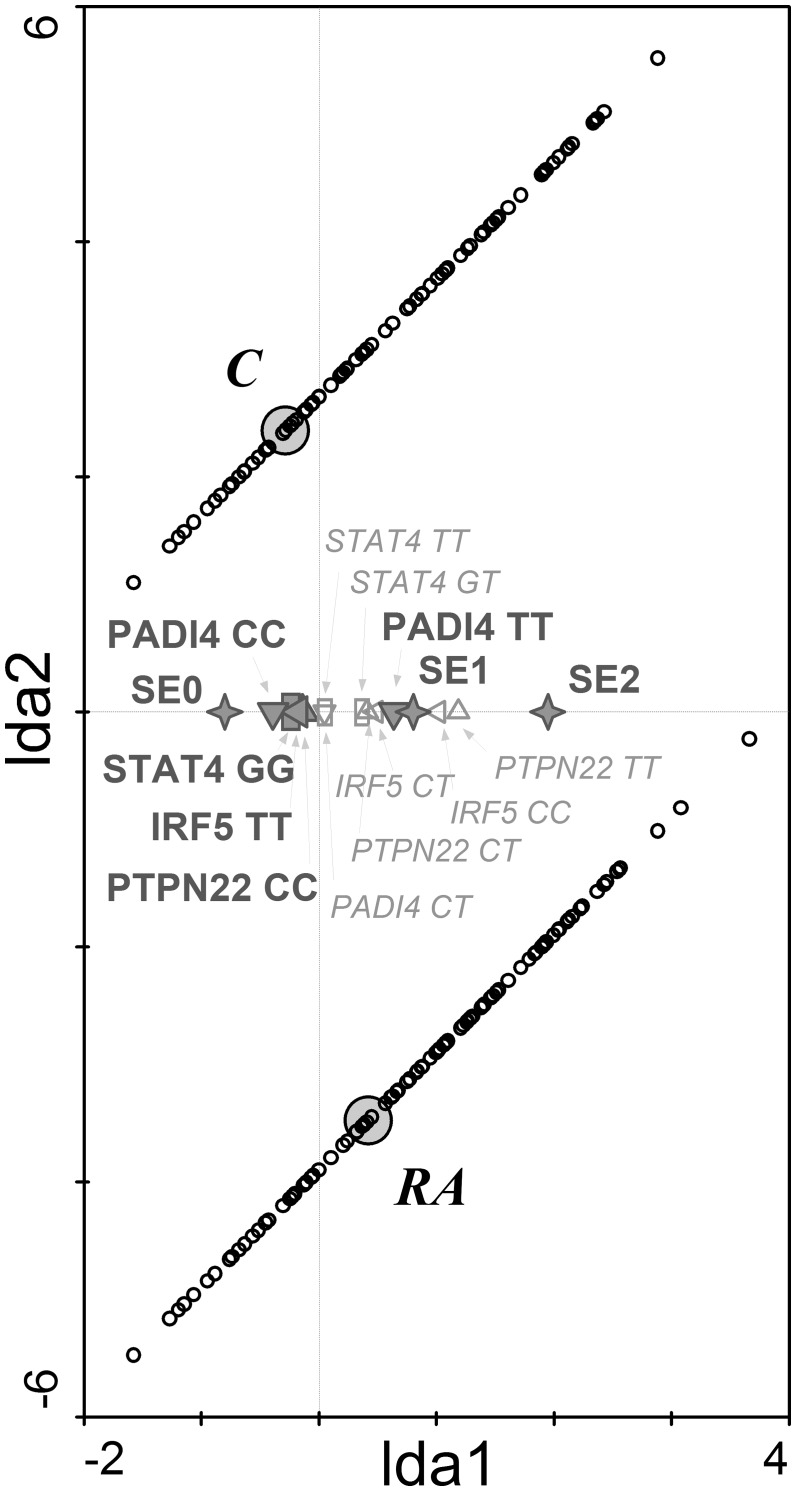
Fig 1. The genetic discrimination of RA patients and controls.
Linear discrimination analysis diagram shows that shared epitope and single nucleotide polymorphisms in PTPN22, STAT4, IRF5 and PADI4 genes significantly discriminated between RA patients and healthy controls. RA—RA patients; C—control group; SE (0,1,2)—number of SE coding allele in HLA-DRB1 gene (✧); IRF5 (CC, CT, TT)—genotypes in IRF5 gene (C risk allele) (◁); PADI4 (TT, CT, CC)–genotypes in PADI4 gene (T risk allele) (▽); PTPN22 (CC, CT, TT)–genotypes in PTPN22 gene (A risk allele) (△); STAT4 (GG, GT, TT)–genotypes in STAT4 gene (T risk allele) (☐). Diagram reading clue: Small circles represent individual cases. Large grey circles—centroids—represent subject groups (RA patients and controls). Symbols are genetic factors. Large bold symbols represent genotypes significantly influencing the distribution of subjects. Small empty symbols represent other genotypes of selected genes. The closer to the group centroid the gene symbol lies, the stronger is its impact on the classification of subjects to particular group.

