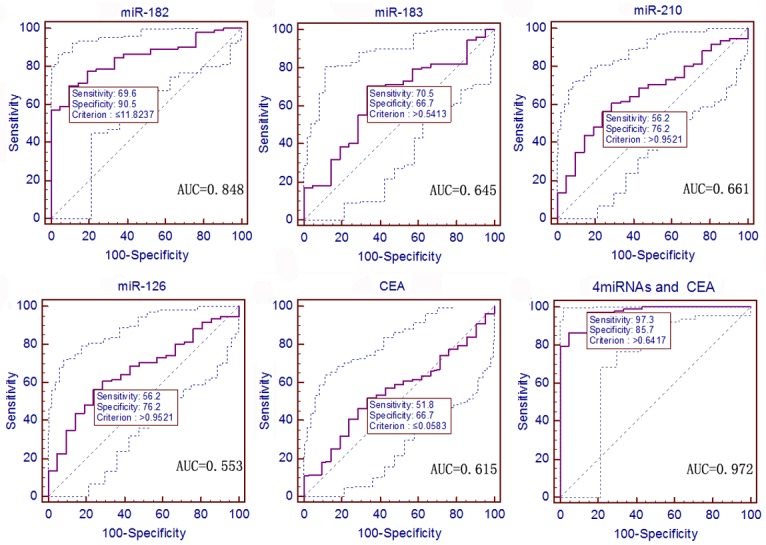
Fig 7. ROC curves to assess the value of serum miRNA and CEA levels in 112 NSCLC patients compared to 21 gastric cancer patients.

The P values of serum miR-182, miR-183, miR-210, miR-126, and CEA as well as the predictive value of logistic regression were < 0.0001, 0.0241, 0.0063, 0.3961, 0.0744, and < 0.0001, respectively.
