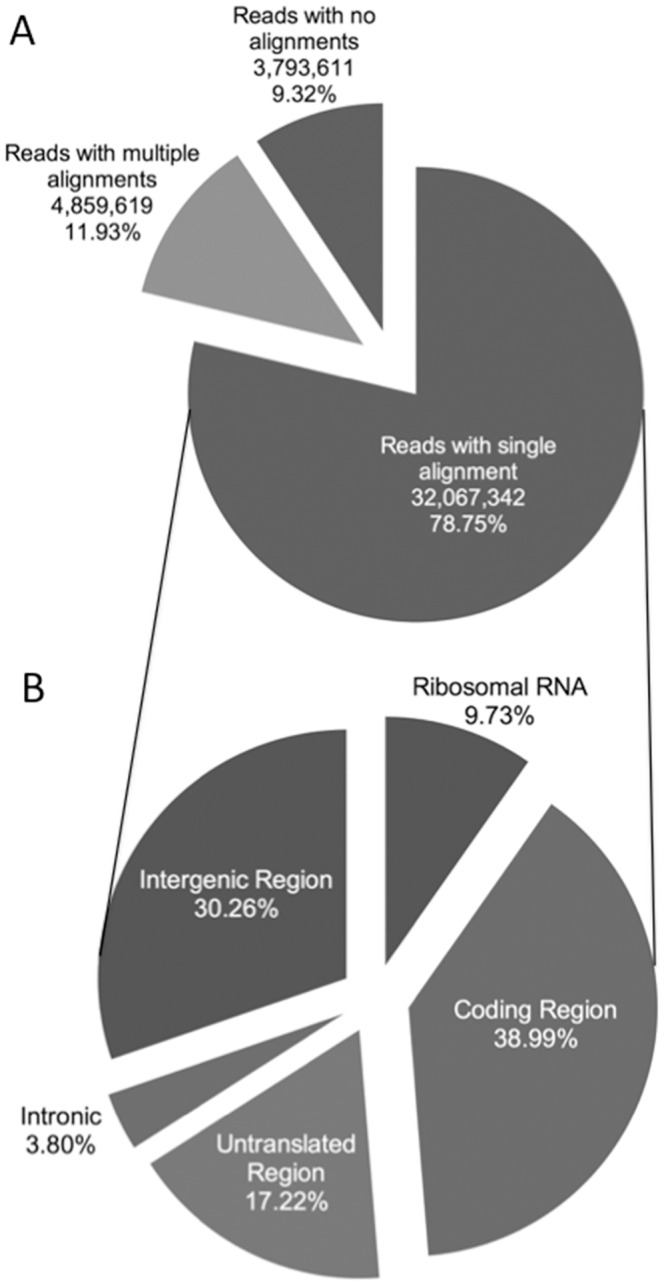
Fig 1. Description of reads mapping to single and multiple locations in the B. taurus genome.

A) Pie chart showing the mean number and percentage of reads that aligned to the reference genome using TopHat and Bowtie. B) Pie chart showing the mean percentage of uniquely mapped reads assigned to coding regions (i.e. known exons), untranslated regions (i.e. 3’ or 5’ untranslated regions), intronic regions (i.e. known introns), intergenic regions (i.e. areas where no known annotated genes are present), and ribosomal RNA based on alignment data from HTSeq and Piccard Tools.
