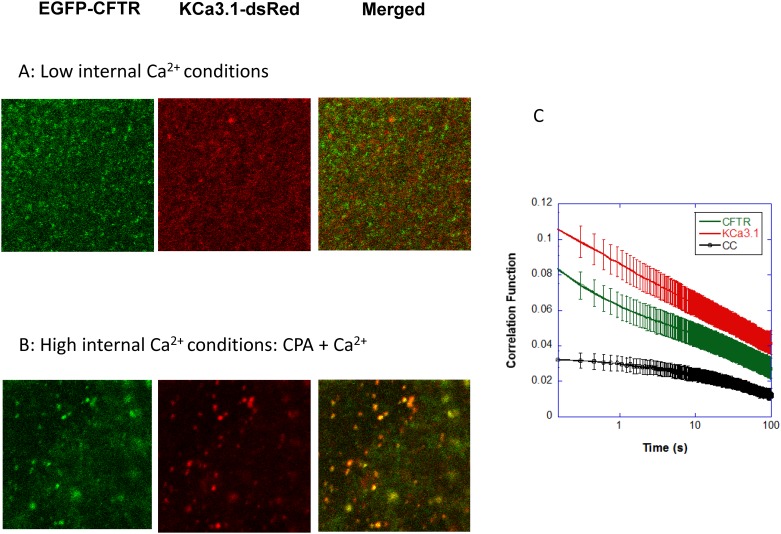
Fig 3. The temporal autocorrelations and the cross-correlation functions of EGFP-CFTR and KCa3.1-dsRed.
A: Examples of confocal microscopy images obtained after excitation of EGFP-CFTR and KCa3.1-dsRed at 488 nm and 561 nm respectively, in low Ca2+ conditions. Merged figures support colocalization of EGFP-CFTR and KCa3.1-dsRed at the membrane (orange). B: Examples of confocal microscopy images obtained for EGFP-CFTR and KCa3.1-dsRed following CPA pretreatment in zero Ca2+ and addition of external Ca2+ to initiate Ca2+ influx. Merged figures (orange) showed the formation of larger KCa3.1 clusters after internal Ca2+ increase. C: Evidence for CFTR/KCa3.1 interactions provided by cross-correlation measurements (see Eq 1b in Materials and Methods section). CFTR-KCa3.1 interactions on the plasma membrane yielded a non-zero cross-correlation function (black) at the slow time scales of the correlation function. This strongly suggests that only the slow populations of CFTR and KCa3.1 interact.

