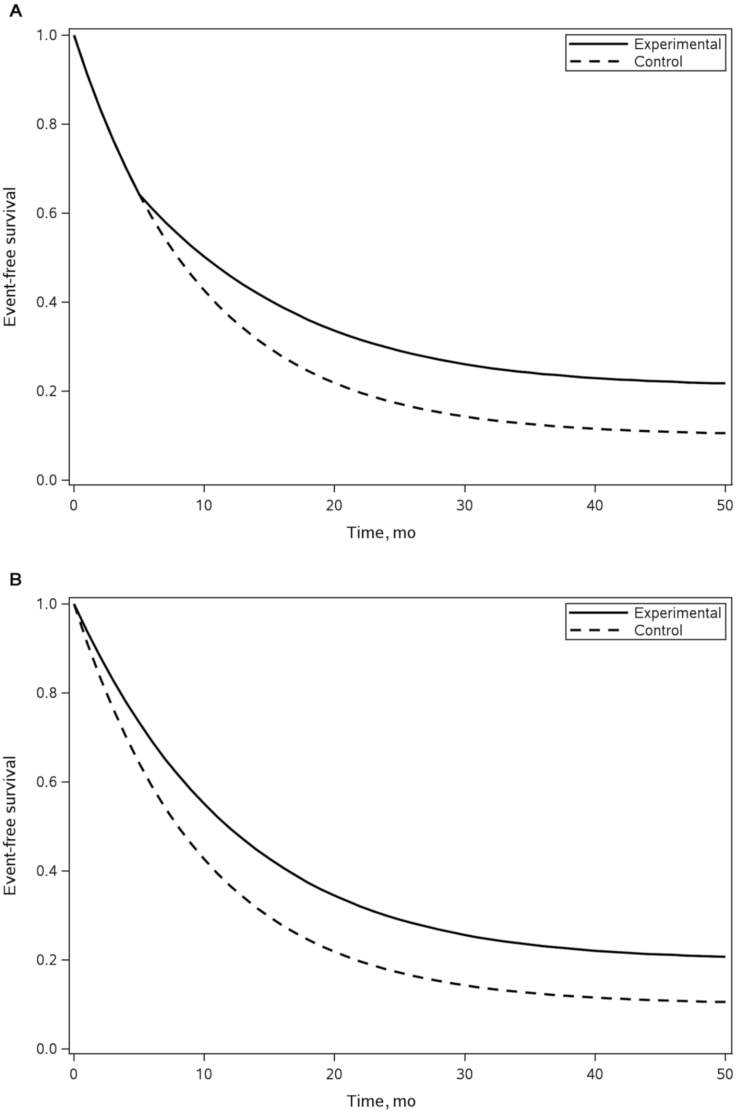
Figure 1.
Graphical presentation of Kaplan-Meier survival curves with combinations of long-term survival and delayed clinical effect. The graphs show two hypothetical scenarios of overall survival outcomes where the top and bottom curves represent a novel immuno-oncologic agent and a control treatment, respectively. A) Nonproportional hazards cure rate model with long-term and delayed effects. B) Proportional hazards cure rate model with long-term survival.

