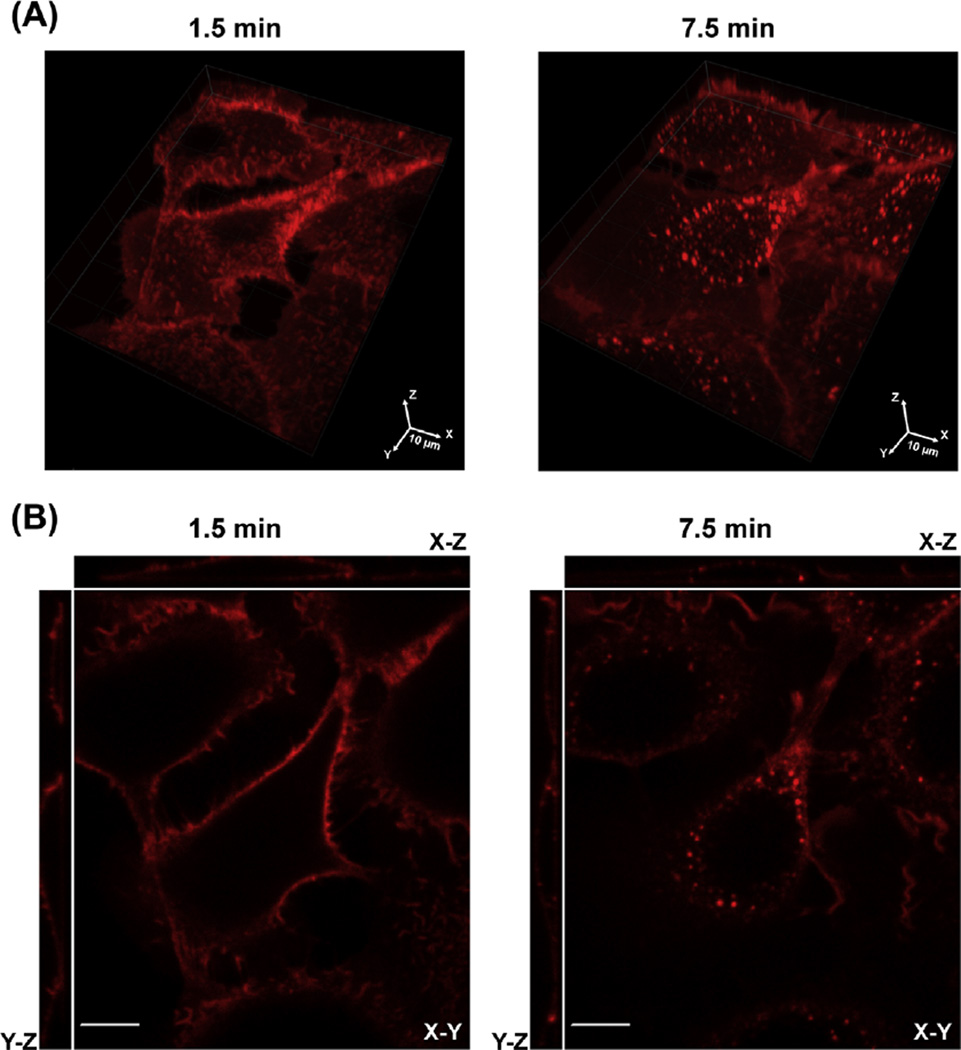
FIGURE 1. Time-lapse imaging of UMSCC2 cells stimulated with EGF-Rhodamine (EGF-Rh).
Cells were imaged before and after EGF-Rh (4 ng/mL) stimulation for 15 min. Z-stacks of 20 x–y images (400 nm z-stepsize) of Rhodamine fluorescence were acquired every 1.5 min. 1.5 and 7.5 min images are shown. 3-D volume view image (A) and “3-D view” image (single confocal x–y, y–z, and x–z sections) are presented (B). Scale bars, 10 µm. (See color plate)

