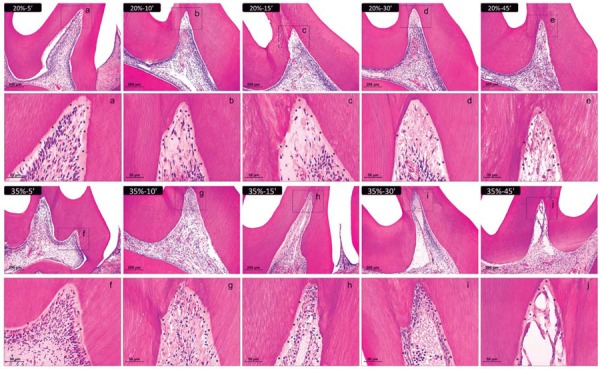
Figure 3. Representative images of hematoxylin & eosin-stained sections showing the coronal pulp 2 days after bleaching. Panels A, B, C, D, and E represent the groups treated with 20% H2O2 gel and panels F, G, H, I, and J represent those treated with 35% H2O2 gel for 5, 10, 15, 30, and 45 min, respectively (100× magnification). Panels a–j are magnified images (400×) of the insets in panels A–J, respectively. Asterisks indicate the predentin layer. The number of inflammatory cells and fibroblasts was obtained in each third of the pulp tissue (at 1000× magnification) and subjected to the Kolmogorov-Smirnov normality test, two-way analysis of variance, and Tukey’s test (p<0.05); the scores of odontoblastic layer and vascular changes underwent Kruskal-Wallis and Dunn’s tests (p<0.05).