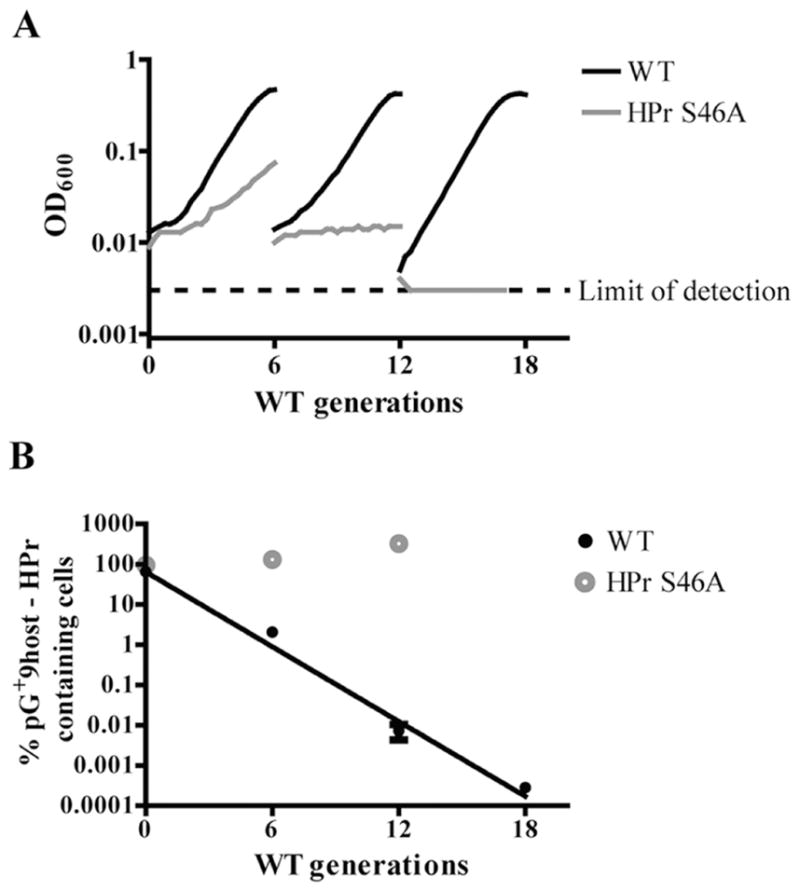
Fig. 9. HPr S46A is a lethal mutation. WT and HPr S46A both carrying the complementing pG+host9-HPr plasmid were grown for successive generations in 0.5% galactose CDM at a non-permissive temperature (37°C), by back-diluting every six generations.

A. Successive growth curves of a representative of each strain are shown (WT: black line; HPr S46A: gray line). Samples were plated every six generations with and without selection at 30°C to determine the proportion of plasmid-bearing cells remaining (WT: closed black circles; HPr S46A: gray open circles).
B. The percent of plasmid-containing cells is reported as the average of three biological replicates with error bars representing the standard error of the mean. A linear regression was fit to the WT data, demonstrating a linear relationship between plasmid loss and log10 number of generations.
