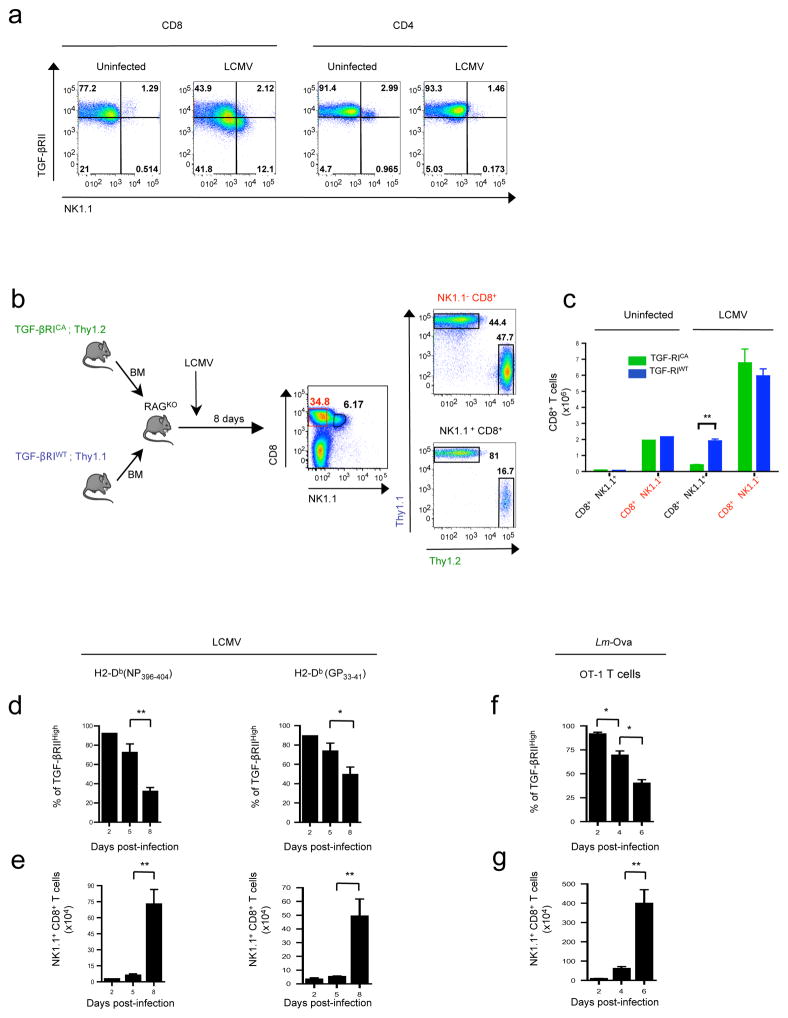
Figure 1. TGF-β signaling represses NK1.1+ CD8+ T cell differentiation.
(a) Flow cytometry analysis of TGF-(βRII and NK1.1 expression at the surface of either CD8+ T cell splenocytes or CD4+ T cell splenocytes 8 days after LCMV infection of B6 mice. Data are representative of 4 experiments with 3–4 animals per group. (b–c) T cell- depleted bone marrow (BM) cells from CD4-Cre; Stopfl/fl Tgf-/βRICA Thy1.2 B6 mice (TGF- βRICA) or Thy 1.1 B6 mice (TGF-βRIWT) were mixed at a 1:1 ratio and transferred into irradiated rag2KO mice (RAGKO). Chimeras were infected with LCMV 5 weeks later and splenocytes analyzed by flow cytometry 8 days post-infection for the BM origin of NK1.1+ CD8+ T splenocytes. (c) Graph illustrating the absolute number of NK1.1+ CD8+ T cells and NK1.1− CD8+ T splenocytes derived from each BM donor (mean + SD, n=3 representative of 2 experiments). (d) Graph illustrating the percentage of both LCMV specific H2-Db(NP396–404) tetramer+ CD8+ splenocytes and LCMV specific H2-Db(GP33–41) tetramer+ CD8+ splenocytes expressing high levels of TGF-(βRII at different times after LCMV infection. (e) Graph illustrating absolute numbers of LCMV specific H2-Db(NP396– 404) and LCMV specific H2-Db(GP33–41) tetramer+ CD8+ splenocytes expressing NK1.1 at different times after LCMV infection. Data are representative of three experiments and shown as mean + SD n=5 per point. (f–g) Naïve (CD44low CD62Lhigh) OT-1 T cells were adoptively transferred into B6 mice, infected the following day by Lm-Ova. The graphs illustrate the percentage of OT-1 splenocytes expressing high levels of TGF-(βRII (f) and the absolute numbers of NK1.1+ OT-1 T cells at different times after Lm-Ova infection (g). Data are representative of 3 experiments and shown as mean + SD n=3 per point.

