
Figure 3. Tet3 expression regulates glutamatergic synaptic transmission and synaptic scaling.
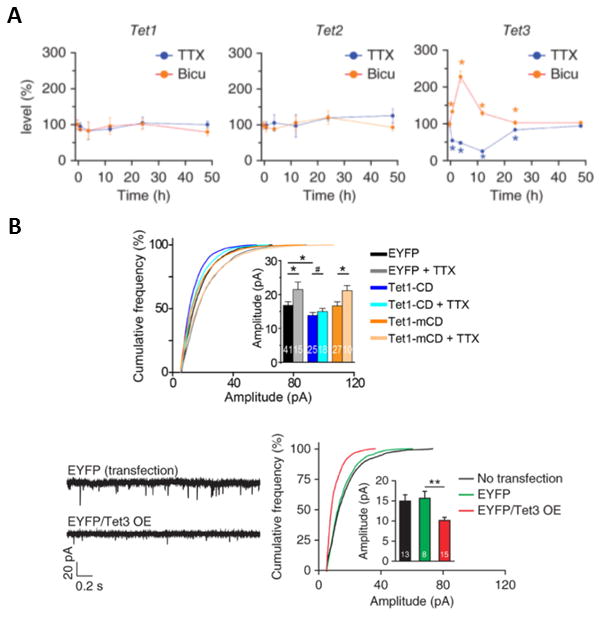
(A) Synaptic activity-dependent expression of Tet3 regulates glutamatergic synaptic transmission. In these experiments the effects of TET1 knockdown (left panel), TET2 knockdown (middle panel) and TET3 knockdown (right panel) were evaluated, and overall glutamatergic synaptic activity was quantitated as a percent of control. In all cases the effects of TET isoform knockdown were evaluated ether in the presence of sodium channel blockade (TTX, blue graphs) or GABA receptor blockade (Bicuculline, orange graphs). Tet3-knockdown neurons exhibited elevated glutamatergic synaptic transmission when GABA receptors were blocked (right panel). (B) Neurons overexpressing TET3 catalytic domain exhibit decreased glutamatergic synaptic transmission, and TET3 catalytic domain overexpression blocks TTX-induced synaptic upscaling. The left and right bottom panels illustrate that TET3 catalytic domain overexpression (EYFP/Tet3 OE) down-scales glutamatergic synaptic transmission relative to enhanced yellow fluorescent protein (EYFP) controls (red versus green bars). The upper panel presents cumulative probability curves demonstrating that TTX by itself triggers upscaling (gray bars), while TET1 catalytic domain (Tet1-CD) triggers downscaling (blue bars) and blocks the TTX-induced upscaling (aqua bars). The orange bars illustrate that the effects of TET1 catalytic domain are dependent on the activity of the enzyme, because they are not mimicked by transfection of a mutant catalytically inactive catalytic domain (Tet1-mCD). Values represent mean ± s.e.m. (*P < 0.05, **P < 0.01). Figure and legend adapted from (Yu et al. 2015). Please see (Yu et al. 2015) for additional details.