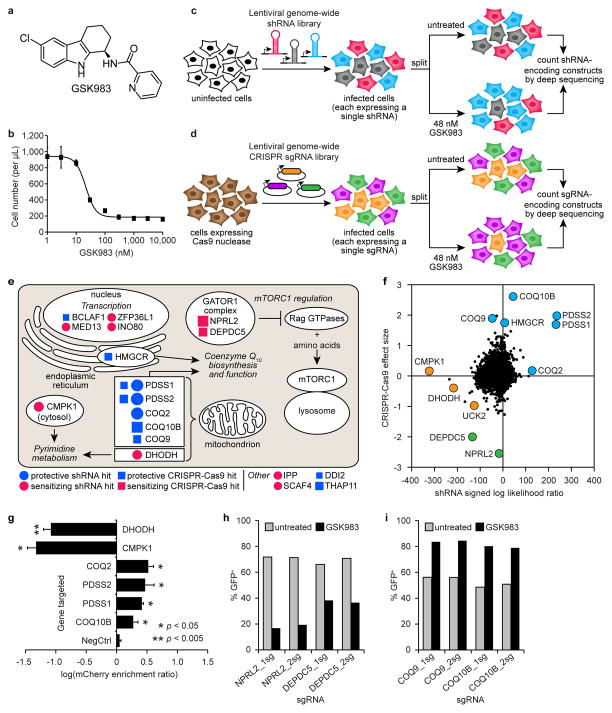
Figure 1.
shRNA and CRISPR-Cas9 screens to identify the cellular target and mechanism of action of GSK983. (a) Structure of GSK983. (b) GSK983 dose response in K562 cells. Viable cells were counted by flow cytometry (FSC/SSC) following 72 h GSK983 treatment at the indicated concentration. Error bars represent ± standard deviation of 8 biological replicates from two independent experiments. Schematic representation of genome-wide shRNA (c) and CRISPR-Cas9 (d) screens. (e) Top ten hits from the shRNA and CRISPR-Cas9 screens in cellular and biological context. Circle size is proportional to MLE score absolute value. Square size is proportional to median fold-enrichment or disenrichment. (f) Comparative analysis of results from shRNA and CRISPR-Cas9 screens. Pyrimidine metabolism (orange), CoQ10 biosynthesis (blue), regulation of mTORC1 activity (green). (g) Validation of selected top hit genes from the shRNA screen using a competitive growth assay. A total of 27 shRNAs were retested (6 targeting DHODH; 4 targeting CMPK1; 3 each targeting COQ2, PDSS2, PDSS1, and COQ10B; and 5 negative controls). Error bars represent ± standard deviation of log(mCherry enrichment ratio) values for all retested shRNAs targeting each gene. P values were calculated by Mann-Whitney U test. Validation of selected sensitizing (h) or protective (i) sgRNAs from the CRISPR-Cas9 screen using a competitive growth assay. Bars represent the average of two biological replicates.

