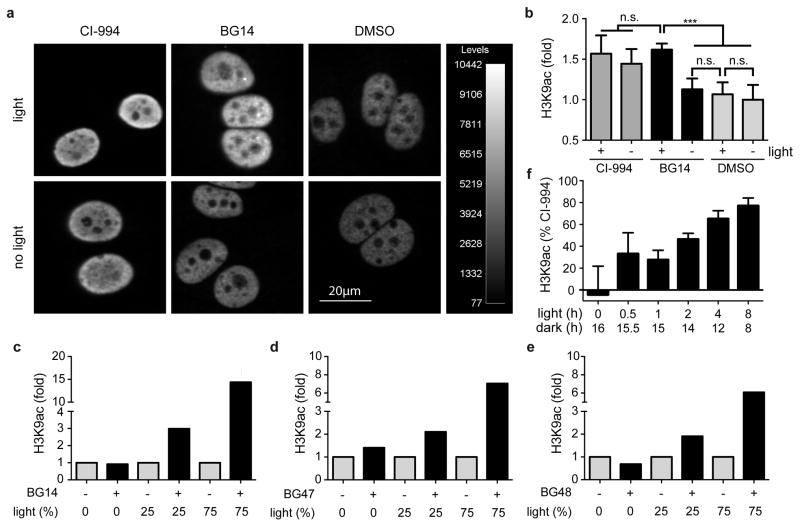
Figure 3. Light-dependent control of the human epigenome with COMET probes.
(a) Immunofluorescence analysis of H3K9ac levels in MCF-7 cells treated with CI-994 (25 μM) and BG14 (25 μM) in presence and absence of light (470 nm, 8.5 mW/cm2, 1Hz, 75% duty cycle). Scale bar = 20μm. (b) Quantification of H3K9ac intensity changes by automated confocal microscopy. Mean values +s.d. are shown (n=3). Significance values (n.s. – not significant, *** p < 0.001) were calculated by one-way ANOVA with Tukey’s post-hoc test (Graphpad PRISM). (c–e) Western blot analysis of H3K9ac levels in MCF-7 cells after treatment with COMET probes at 25 μM and varying amounts of light exposure (Supplementary Fig. 8). Specifically, cells were exposed to no light or pulsing light (470 nm, 8.5 mW/cm2) modulated at a frequency of 1 Hz (the duty cycle is expressed in % ON time). Values were normalized to vehicle treated cells and represent duplicate means of biological duplicates. (f) Persistence of HDAC inhibition. Quantification of relative immunofluorescence intensity of H3K9ac upon treatment of MCF-7 cells with DMSO, CI-994 (25 μM) and BG14 (25 μM) for a total of 16 h experimental time under varying duration of light exposure (470 nm, 8.5 mW/cm2, 1Hz, 50% duty cycle) at the beginning of the treatment period, followed by varying length of dark phases. Cellular H3K9 acetylation levels were normalized within each group to the positive control CI-994 = 100% and DMSO = 0. Mean values +s.d. are shown (n≥3). Detailed statistical values are provided in Supplementary Figure 8.

