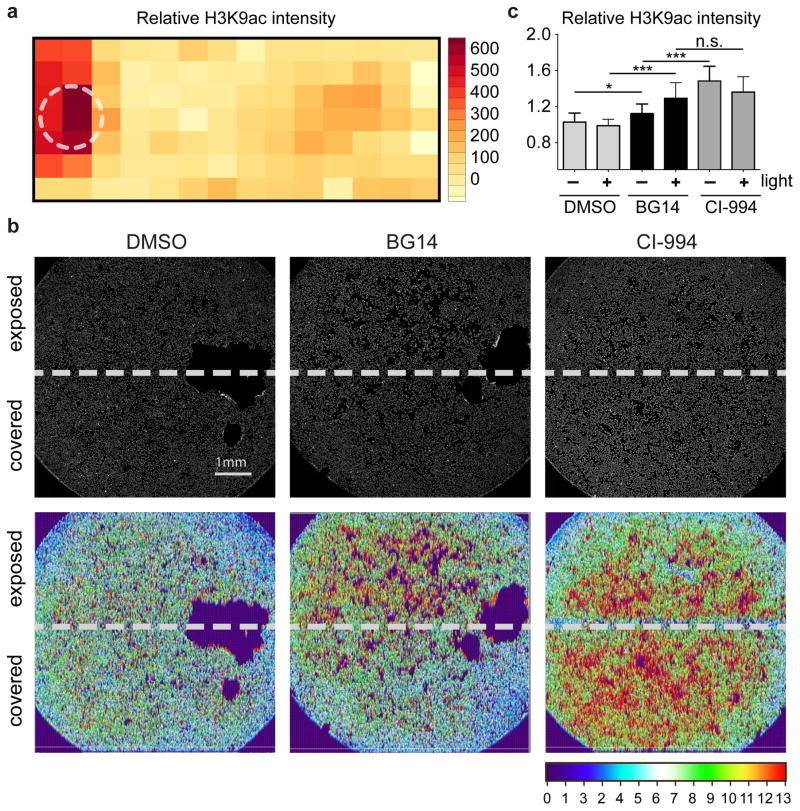
Figure 4. Light-dependent spatial control of epigenetic regulation with the COMET probe BG14.
Quantification of relative immunofluorescence intensity of H3K9ac upon treatment of MCF-7 cells with BG14 and light. (a) MCF-7 cells in a 1-well chamber slide were placed over a 5 mm LED (470 nm, 8.5 mW/cm2, 0.9 Hz, 33% duty cycle for 6 h, followed by 10 h without light exposure). The heatmap represents relative levels of histone H3K9ac (red indicates elevated H3K9ac levels). The white circle indicates position of LED. (b) Wells of a 96-well culture plate were partially covered at the bottom of the plate prior to treatment of MCF-7 cells with DMSO control, BG14 and CI-994 in presence of light for 16 h followed by immunofluorescence staining for H3K9ac. Heatmaps of H3K9ac intensity throughout wells. Scale bar = 1mm. (c) Quantification of H3K9ac spatial intensity differences by automated, confocal microscopy. Mean values +s.d. (n=5). Significance values (n.s. – not significant, * p < 0.05, *** p < 0.001) were calculated by one-way ANOVA with Tukey’s post-hoc test (Graphpad PRISM).

