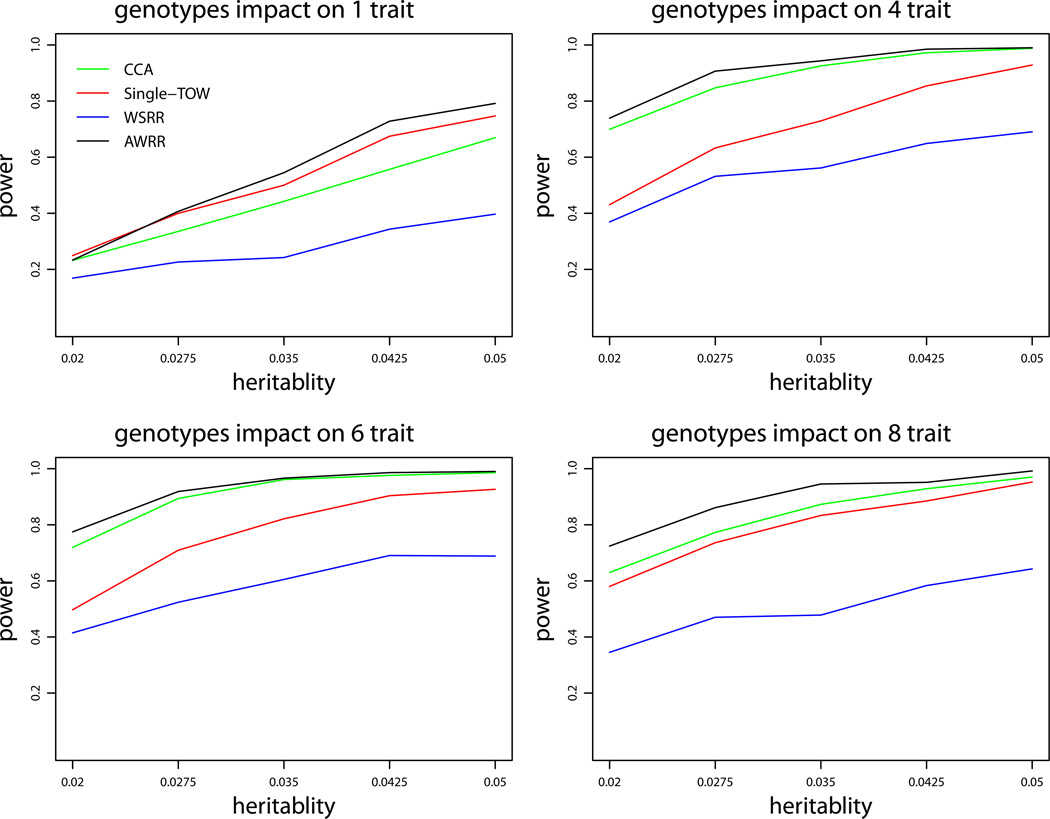
Figure 1.
Power comparisons of the four tests (WSRR, AWRR, CCA and Single-TOW) for the power as a function of heritability for quantitative traits under variance model 1. The sample size is 1000 and ρ = 0.5. The percentage of the causal variants is 0.1. All causal variants are risk variants. The total number of traits is 10. This set of simulations is based on Sgene1.

