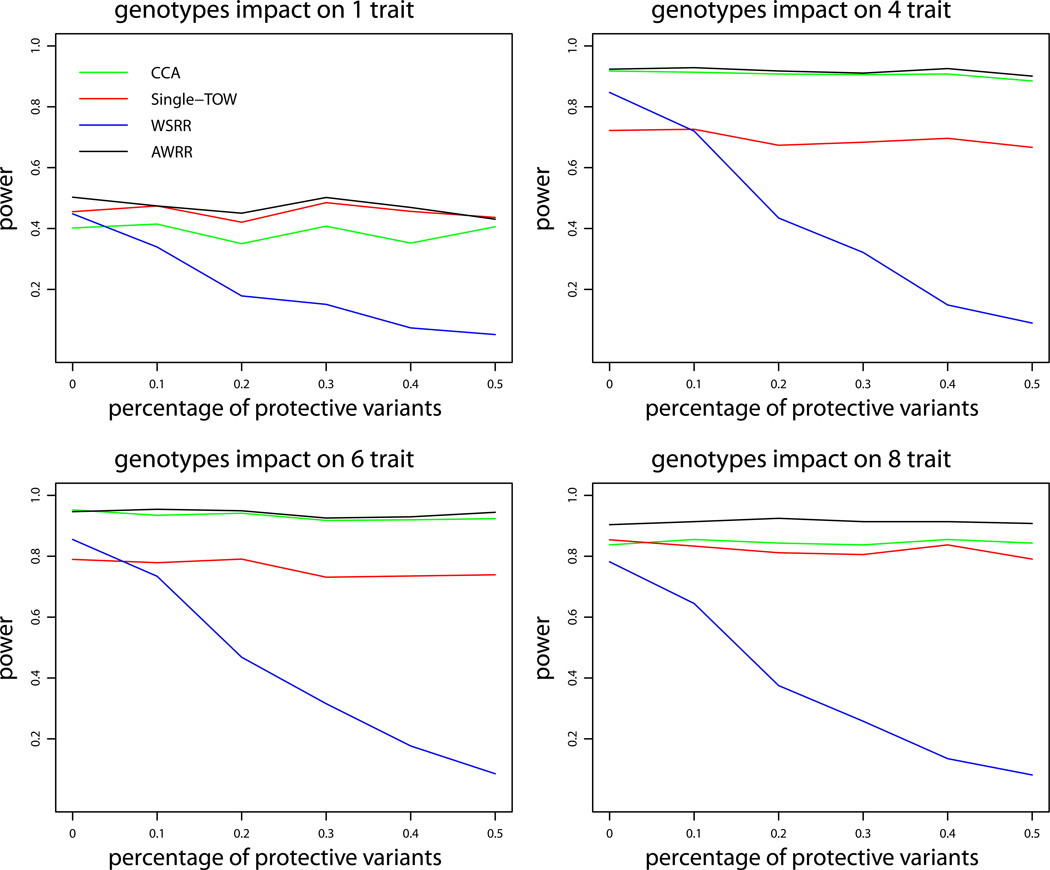
Figure 2.
Power comparisons of the four tests (WSRR, AWRR, CCA and Single-TOW) for the power as a function of percentage of protective variants for quantitative traits under variance model 1. The sample size is 1000, the percentage of causal variants is 0.2, the total heritability is 0.03, and ρ = 0.5. The total number of traits is 10. This set of simulations is based on Sgene1.

