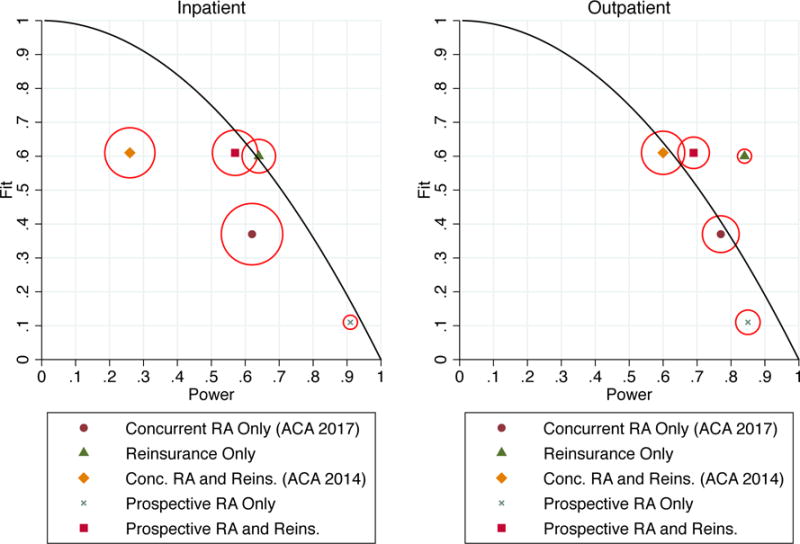
Figure 2.

Fit, Power, and Balance under Risk Adjustment and Reinsurance in the Exchanges
Notes: Figure illustrates fit, power, and balance calculated for several actual and counterfactual payment systems. Vertical and horizontal positions indicate fit and power. The size of the circle around each marker indicates imbalance, with the diameter proportional to the weighted variance of power across the Major Diagnostic Categories (MDCs) examined. The solid curves trace, for reference, the theoretical fit-power tradeoff in a mixed system that reimburses a partial lump sum capitation payment plus a fraction of actual expenses.
