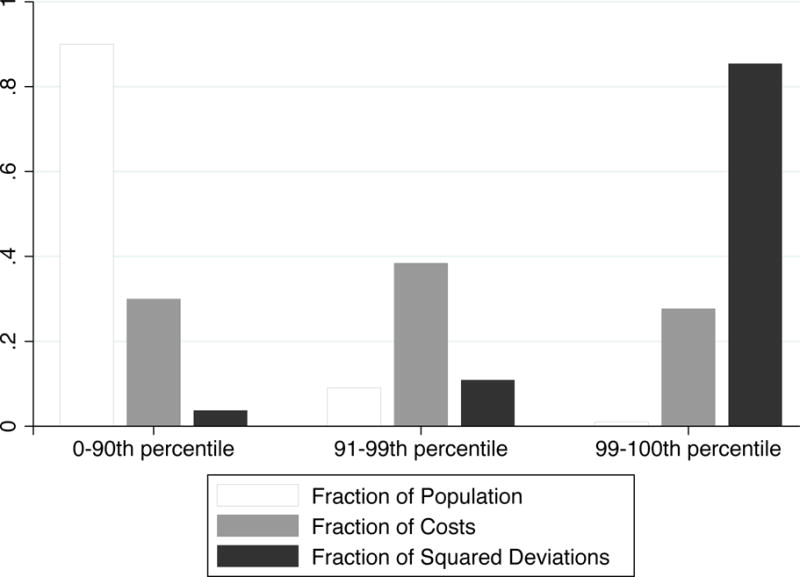
Figure 3.

Skewness in Healthcare Spending
Notes: Figure shows distributions of costs and squared deviations of costs in the population, across groups defined by percentiles of individual costs: [0, 90), [90, 99), and [99, 100]. Vertical bars represent the fraction of the population within the percentile group, the fraction of total spending accounted for by the group, and the fraction of squared deviations accounted for by the group.
