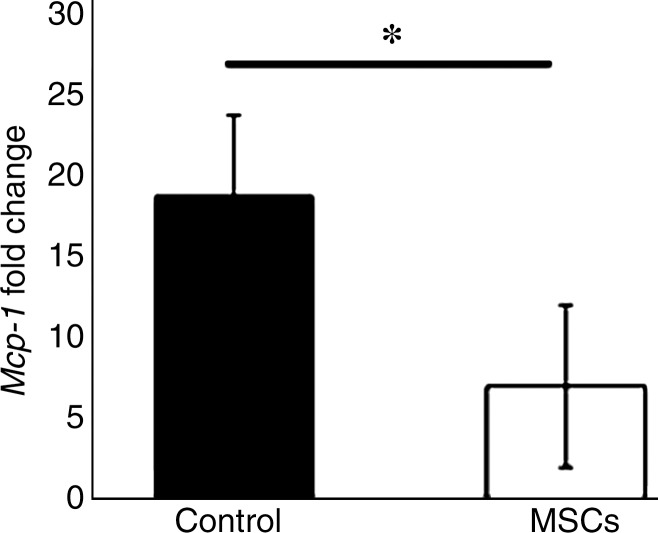
Figure 2:
Graph shows Mcp-1 gene expression on day 7 in vessels with transplanted MSCs compared with outflow vein vessels removed from control animals. There is a significant decrease in mean Mcp-1 gene expression in the vessels with transplanted MSCs when compared with the control group (P < .05). Each bar shows the mean ± standard error of the mean of four to six animals per group. Two-way analysis of variance with the Student t test was performed. * = Significant (P < .05) differences among vessels with transplanted MSCs and control vessels.

