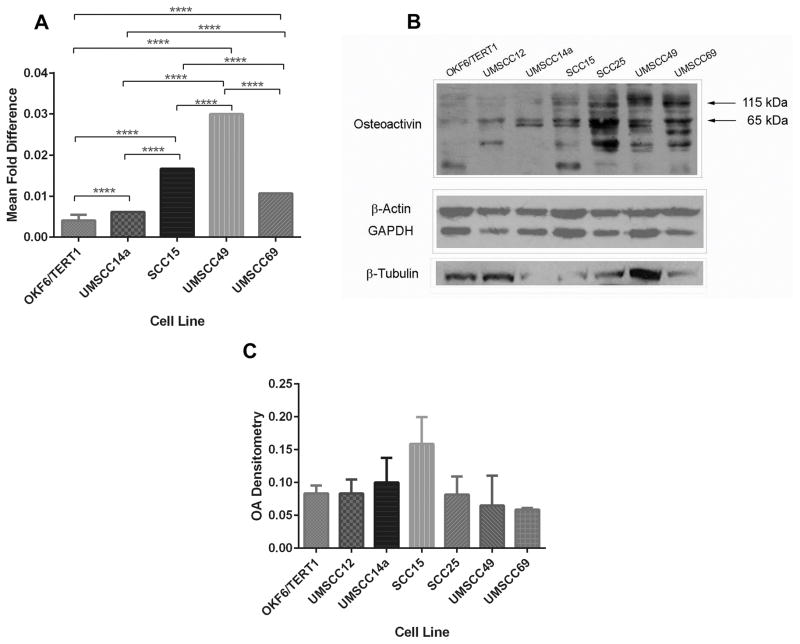
Figure 1. OA is differentially expressed in OSCC cell lines.
(A) Total RNA was obtained from OSCC cell lines and immortalized oral keratinocytes, and reverse transcribed. qRT-PCR was used to compare expression of OA mRNA in the cell lines, normalized to β-actin. Graph depicts mean fold differences ± standard deviations. All OSCC cell lines expressed OA mRNA to a greater extent that OKF6/TERT1 immortalized oral keratinocytes (p<0.0001). OA mRNA expression also differed significantly between the cell lines tested (p<0.0001 for all comparisons). (B) OKF6/TERT1 immortalized oral keratinocytes and HNSCC cell lines were grown to subconfluence. Lysates (45 μg/lane) were resolved by SDS-PAGE, and total protein measured with infrared imaging after gel staining with GelCode® Blue (top left). Similarly loaded gels were used for protein transfer to membranes, and stained after transfer (top right). Membranes were probed with OA antibody (bottom left) and OA expression was normalized to total protein (bottom right, means ± standard errors).

