Figure 1.
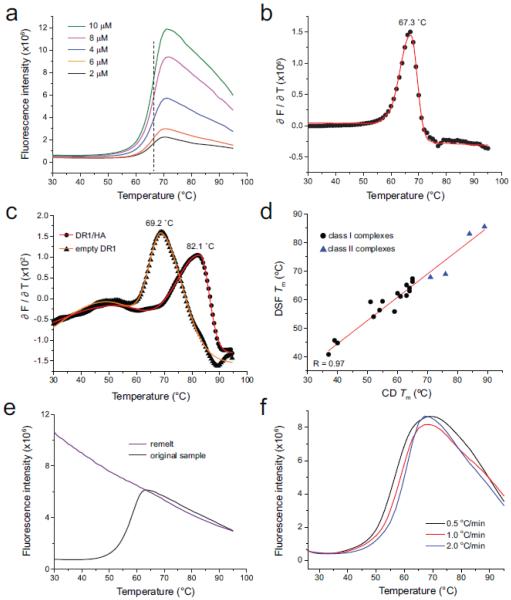
Quantitative analysis of differential scanning fluorimetry in assessing class I and class II MHC/peptide stability. A) Progress curves for different concentrations of the class I TYR/A2 complex. Overall fluorescent intensity varied with concentration, but the midpoint of the transition was a constant 67 °C, as indicated by the vertical dashed line. B) The first derivative of the progress curves provides a means to robustly determine Tm values, as shown for the TYR/A2 complex at 2 µM. Black dots indicate the first derivative data; the red line is a baseline-corrected bi-Gaussian peak fit. C) First-derivative analysis and associated fit of the data for the class II HA/DR1 complex (circles) and ‘empty’ DR1 (triangles). D) peptide/MHC Tm values determined by DSF correlate with those determined by CD spectroscopy. Black circles are class I complexes; blue triangles are class II. The correlation coefficient (R) for the linear fit to the data (red line) is 0.98. E) peptide/A2 denaturation remains irreversible when studied by DSF. The black curve shows the DSF scan of a fresh sample of the SL9 peptide bound to A2 with a Tm of 59 °C. The purple line shows a rescan of the same sample after cooling to 25 °C. F) Thermal denaturation of peptide/A2 complexes show a scan rate dependence, as indicated here for the MART126(2L)-35 peptide bound to A2.

