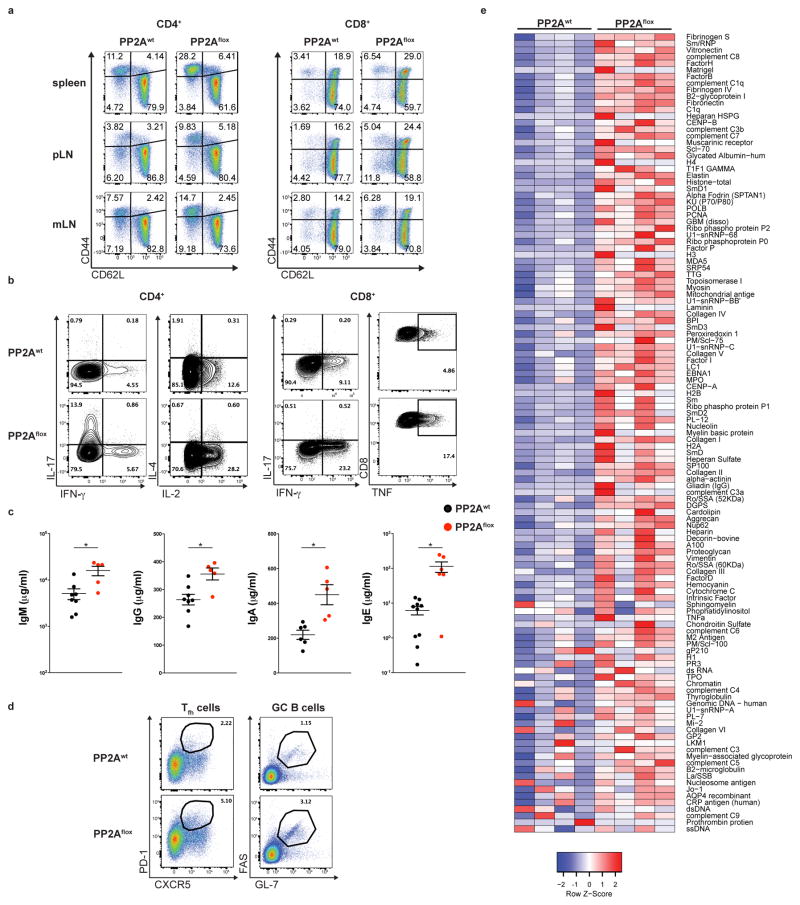
Figure 2. Spontaneous T cell and B cell activation in PP2Aflox mice.
(a, b) CD4+ and CD8+ T cells of 10–14 week-old PP2Awt and PP2Aflox mice were stained for CD62L and CD44 (a, spleen, peripheral and mesenteric lymph nodes) and for the production of the indicated cytokines (b, spleen). Data shown are from one experiment representative of three independent experiments (n=3 mice per group) (c) The levels of serum IgM, IgG, IgA and IgE in PP2Awt and PP2Aflox mice were quantified (n=8 for PP2Awt and n=5 for PP2Aflox mice). (d) The percentages of T follicular helper (Tfh) cells and germinal center (GC) B cells in the spleen from PP2Awt and PP2Aflox mice are shown. Data shown are from one experiment representative of two independent experiments (n=3 mice per group per experiment). (e) Sera from PP2Awt and PP2Aflox mice were analyzed for the presence of autoantibodies. Each individual column of the heatmap represents an individual mouse (total 4 mice per group). Mean ± s.e.m is shown. *P<0.01 (unpaired, two-tailed t-test).

