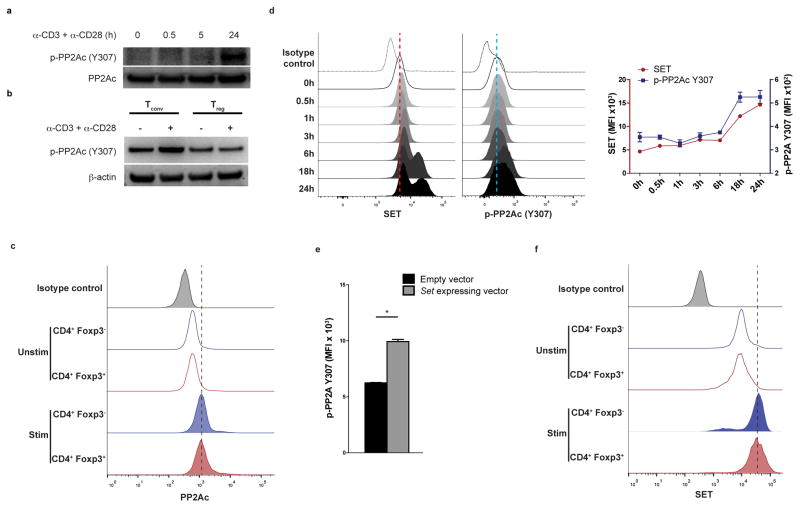
Figure 3. TCR activation induces SET-mediated phosphorylation of PP2AC at Y307 in Tconv cells but not Treg cells.
(a, b) Naïve CD4+ T cells (a) or Tconv and Treg cells (b) were stimulated with CD3 plus CD28 antibodies for the indicated time periods. Immunoblotting for p-PP2AC (Y307) was then performed. Data are from one experiment representative of two independent experiments with similar results (n=3 mice per experiment). (c, f) Splenocytes isolated from Foxp3IRES-GFP mice were stimulated with CD3 plus CD28 antibodies for 24 hours or left unstimulated. Intracellular staining was then performed for PP2AC (c) or SET (f). Data are from one experiment representative of three independent experiments with similar results (n=3 mice per experiment). (d) Naïve CD4+ T cells were stimulated with CD3 plus CD28 for 0, 0.5, 1, 3, 6, 18 and 24 hours. Intracellular staining was then performed for SET and p-PP2AC (Y307). A representative histogram (left) and quantification of the results (right) is shown from one of two independent experiments with similar results (n=3 per group). (e) Intracellular staining for p-PP2AC (Y307) of naïve CD4+ T cells activated with CD3 plus CD28 antibodies for 24 hours and then spin-infected with an empty or a Set-expressing mCherry lentiviral vector. The analysis was done on mCherry+ T cells (n=5 per group, one of two experiments with similar results is shown). Mean ± s.e.m. is shown, MFI: Mean fluorescent intensity, *P<0.01 (unpaired, two-tailed t-test).

