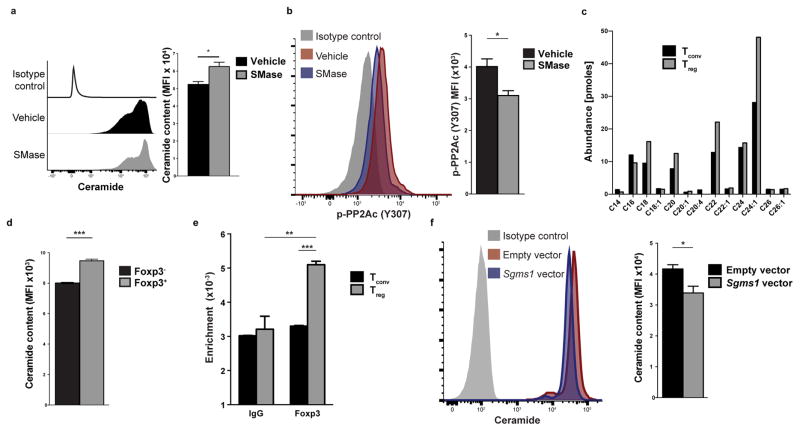
Figure 4. Treg cells display higher ceramide content through Foxp3-mediated inhibition of Sgms1.
(a, b) Naïve CD4+ T cells were stimulated with anti-CD3 plus anti-CD28 for 24h and then treated with sphingomyelinase (SMase, 0.5 units/mL) or vehicle (50% glycerol in PBS) for 1h. The cells were then stained for ceramide (a) or p-PP2AC (Y307) (b). A representative histogram (left) and quantification of the results (right) is shown (n=3, one of two experiments with similar results is shown). (c) Tconv and Treg cells were stimulated for 24h and then subjected to ESI-MS/MS for the quantification of ceramide species. (d) Ceramide content of CD3+CD4+Foxp3− and CD3+CD4+Foxp3+ was quantified using flow cytometry (n=3 mice). Data are from one of three experiments with similar results. (e) Tconv and Treg cells were subjected to chromatin immunoprecipitation using a Foxp3-specific antibody or an IgG control antibody. Shown is binding enrichment at the mouse Sgms1 gene, normalized to the input (n=3 per group, one representative of two independent experiments with similar results is shown). (f) Naïve CD4+ T cells were stimulated for 24h and then spin-infected with an mCherry-expressing lentivirus that harbored or not the murine Sgms1 coding sequence. CD4+mCherry+ cells were analyzed for ceramide content using flow cytometry. A representative histogram (left) and quantification of the results (right) is shown. Data are from one experiment representative of two independent experiments with similar results. Mean ± s.e.m. is shown, MFI: Mean fluorescent intensity, *P<0.05, **P<0.01, ***P<0.001 (unpaired, two-tailed t-test).

