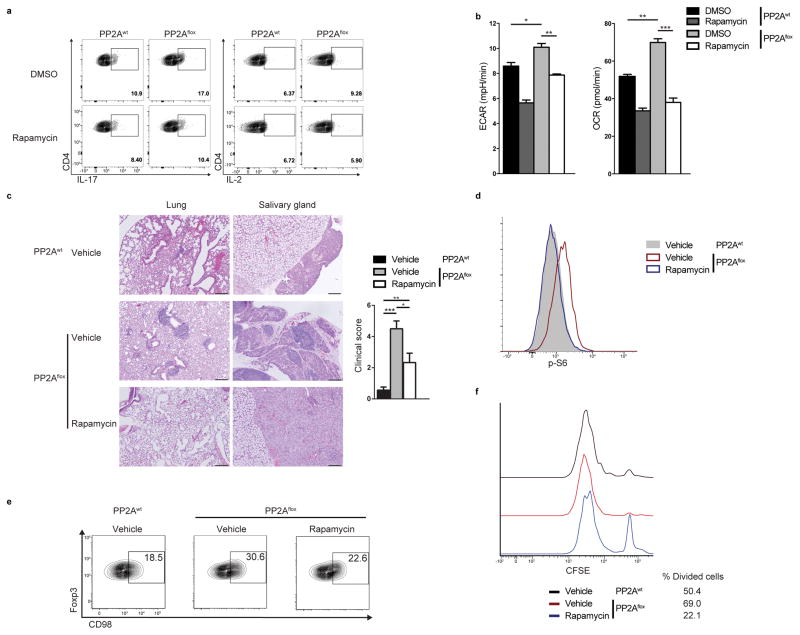
Figure 7. Rapamycin reverses the abnormal profile of the PP2Aflox Treg cells.
(a, b) FACS-sorted PP2Awt and PP2Aflox Treg cells were stimulated with CD3 plus CD28 and then expanded for 4 days in the presence of 100 IU/mL of IL-2. During the final 24 hours, they were treated with 100nM of Rapamycin or DMSO. (a) The Treg cells (gated on FoxP3-YFP+CD4+ T cells) were re-stimulated with PMA/Ionomycin for 6 hours and stained for IL-17 and IL-2. (b) The ECAR and OCR of PP2Awt and PP2Aflox Treg cells (sorted again as Foxp3-YFP+CD4+ T cells at the end of the culture) were measured (n=3 mice per group, unpaired, two-tailed t-test). Data are from one experiment representative of two independent experiments with similar results. (c) Left: H&E staining of the lungs and the salivary glands of PP2Awt and PP2Aflox mice treated or not with rapamycin (scale bar represents 100 μm). Images are from one experiment representative of two independent experiments with similar results. Right: combined clinical score of inflammation in the liver, skin, stomach, salivary glands, lungs and pancreas of PP2Awt and PP2Aflox mice treated or not with rapamycin (one-way analysis of variance (ANOVA) followed by Tukey’s multiple comparison test). (d, e) Ex vivo amounts of p-S6 (d) and CD98 expression (e) in Tregs (FoxP3-YFP+) from mice in (c). (f) In vitro suppression assay using effector CD45.1+CD4+ (Teff) T cells and Treg cells from PP2Awt or PP2Aflox rapamycin-treated and vehicle-treated mice. Representative histograms showing CFSE dilution and percentage of divided cells (ratio Treg/Teff: 1/1). Data are from one experiment representative of two independent experiments with similar results. Mean ± s.e.m., *P<0.05, **P<0.01, ***P<0.001.

