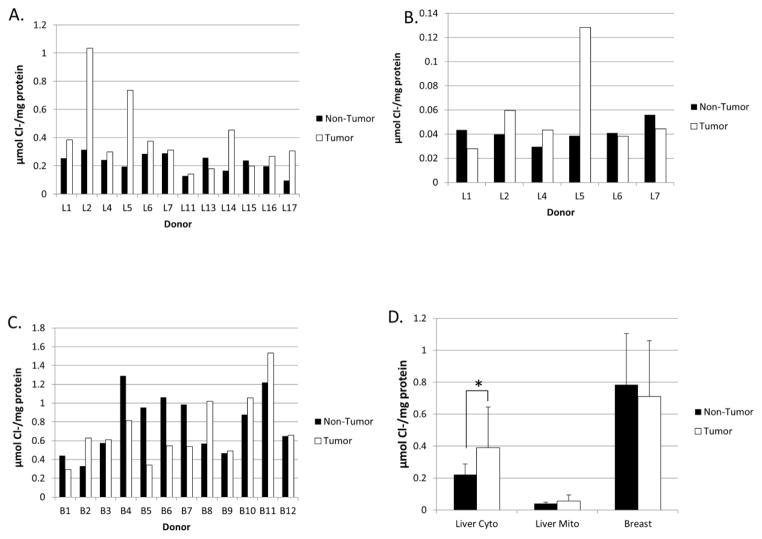
Figure 5.
Chloride concentrations in non-tumor and tumor tissues. The concentration of chloride ion was measured and reported in μmol Cl−/mg of total protein for the liver cytosol (A), liver mitochondria (B), and breast (C). D) Mean Cl− levels in non-tumor vs. tumor tissues from liver cytosol, liver mitochondria, and breast homogenate. Values show the mean of all tissue analyzed, error bars represent the standard deviation, and * denotes p < 0.05 as determined by Student’s t-test.

