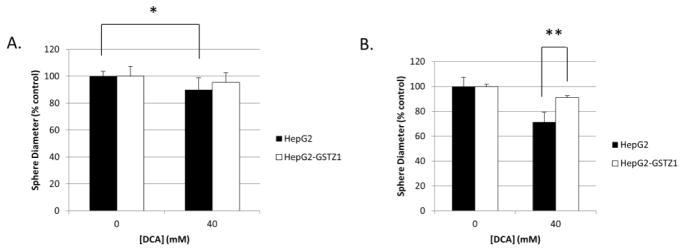
Figure 7.
Three-dimensional cell culture model of GSTZ1-induced resistance to DCA. A) Spheroid diameter, as % control, of HepG2 and HepG2-GSTZ1 cells grown with and without 40 mM DCA for 72 hours. B) Diameter of the same spheroids after a 1 week washout period. * denotes p < 0.05; ** denotes p < 0.0001

