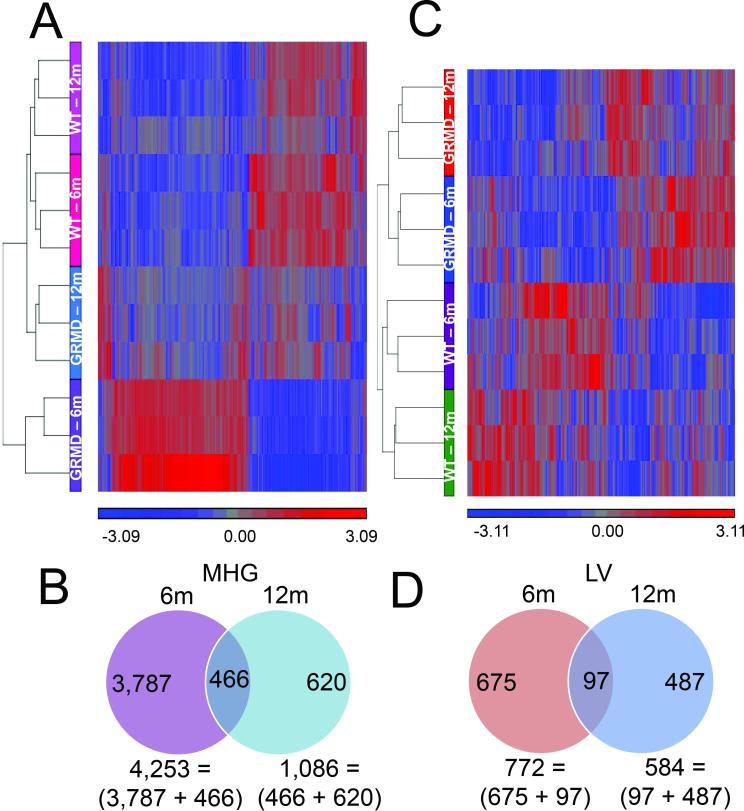
Figure 1. Microarray analysis of GRMD skeletal muscle.
Hierarchical clusters of 5,339 (A) or 1,259 (C) probes differentially expressed between GRMD and WT in skeletal muscle or LV, respectively. Vertical columns represent each of the clustered probes, and horizontal rows correspond to individual samples. Gene expression patterns are shown by color, with bright blue representing the lowest standardized signals, bright red the highest, and gray for median values as indicated by the scale bar beneath the cluster. Venn diagrams show distribution of gene expression differences among MHG (B), or LV (D) samples in 6 and 12 month-old dogs.

