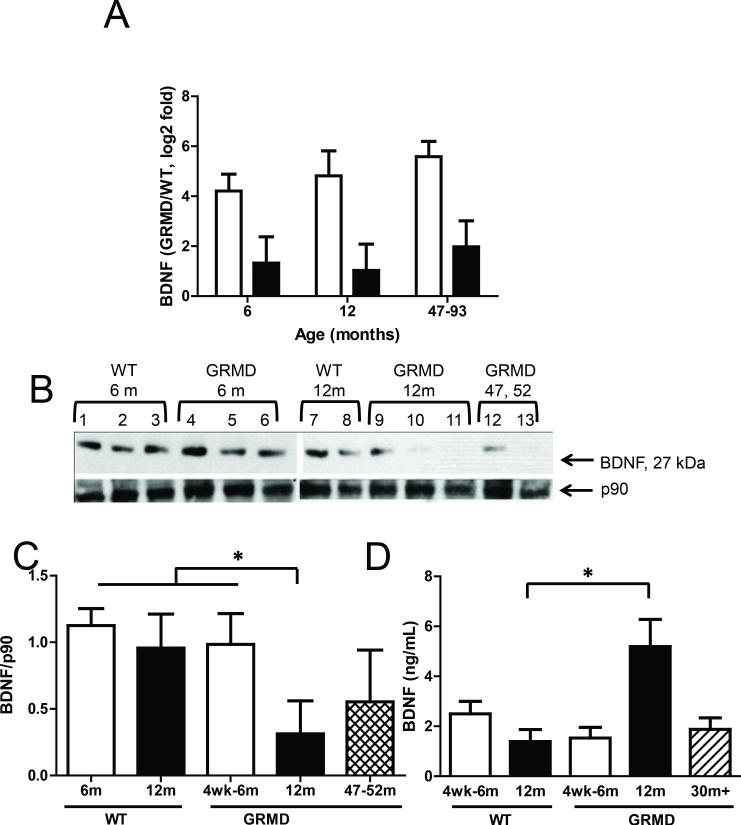
Figure 4. BDNF transcript and protein levels in GRMD.
A, Bar graph shows qPCR results for BDNF in tissues in LV (white bars) and MHG (black bars) tissues from GRMD versus WT dogs. Each group shown includes data from three animals, and error bars represent SEM. B, Western blots for BDNF and p90 (loading control) in LV tissues of WT and GRMD dogs are shown, excluding the 93 month-old GRMD dog for which LV protein was insufficient. C, Bar graph showing semi-quantification of Western blot results for BDNF, as calculated by densitometry, for LV tissues from WT and GRMD dogs aged 6 months (white bars), 12 months (back bars), or 47-93 months (diagonally striped bars). Asterisks indicate significance (p < *0.005). D, Bar graph shows serum levels of BDNF protein as measured by ELISA for 4 week or 6 month-old (white bars), 12 month-old (black bars), and considerably aged (hatched bars) animals. the groups indicated in the legend shown beneath the graph. Asterisks indicate significance (**p = 0.001).

