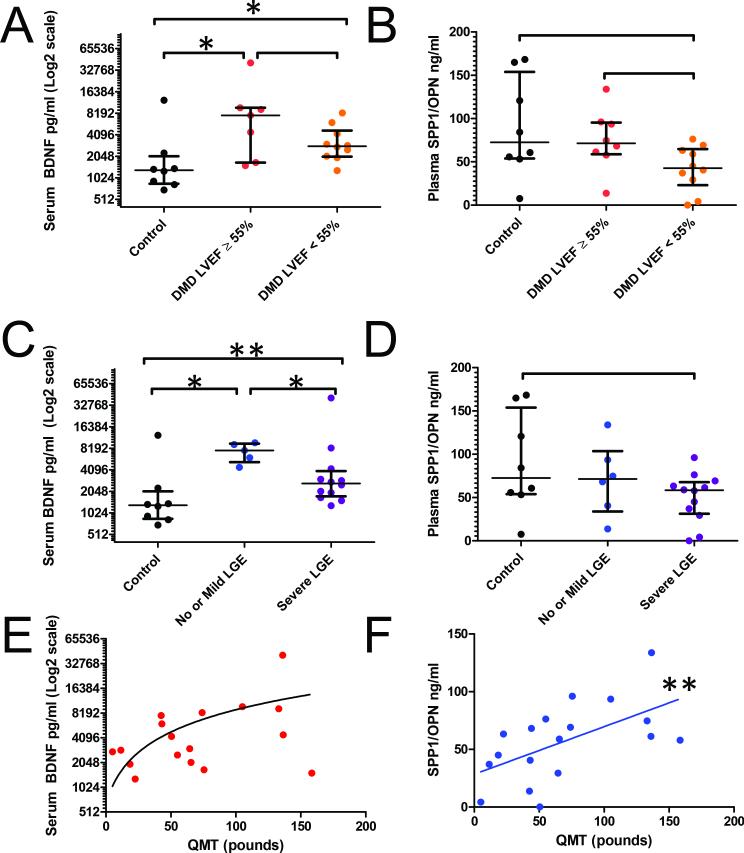
Figure 5. Serum levels of BDNF and SPP1 in DMD and control subjects.
BDNF and SPP1 proteins were measured by ELISA, and results are shown for individuals stratified by heart function, as measured by cardiac magnetic resonance (CMR) left ventricular ejection fraction (LVEF) (A and B) or fibrosis, measured by CMR late gadolinium enhancement (LGE) (C and D). Correlations of BDNF (E, r=0.3, p=0.248) and SPP1 (F, r=0.6, p=0.009) with Quantitative Muscle Testing (QMT) are also demonstrated. Asterisks indicate statistical significance (*p<0.05, **p<.01).

