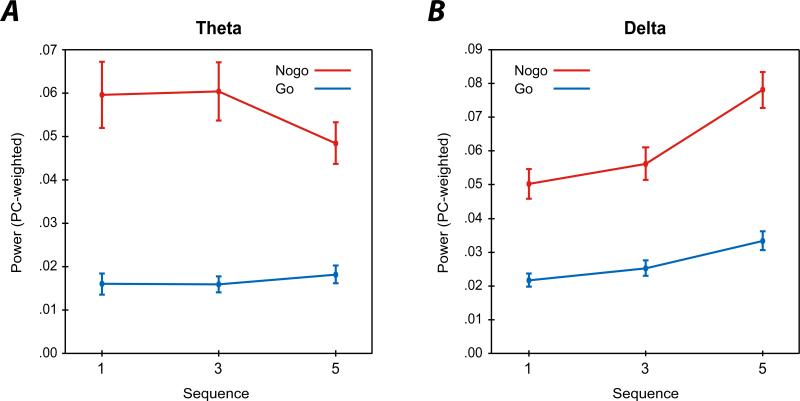
Figure 4.
Section A. Profile plot depicting the mean PC-weighted TF evoked energy theta component scores for go (blue) and nogo (red) conditions by sequence (x-axis). Bars represent standard error of the mean. Section B. Same as Section A, but for delta activity. Evident from the profile plots is the strong increase in nogo delta activity with increasing sequences, and the slight decrease in nogo theta activity following five go trials.

