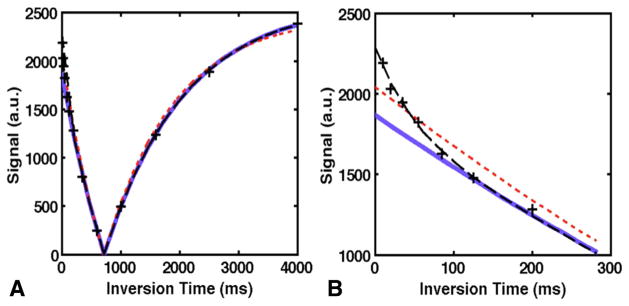
FIG. 2.
Comparison of monoexponential and biexponential fits. (a) Fits to data at the voxel shown in Figure 1a; black dashed line = biexponential fit, red dotted line = monoexponential fit to all data, solid blue line = monoexponential fit to TI >200 ms. (b) Inset showing early TI values only.

