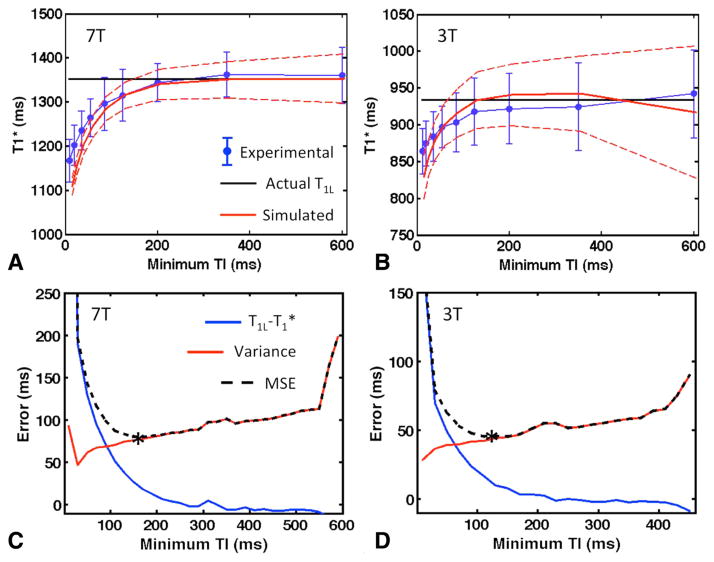
FIG. 5.
Behavior of T1* in IR-FSE acquisitions with increasing minimum TI. (a, b) Comparison of simulated and experimental data at 7T (a) and 3T (b). Blue dots are experimental results of monoexponential T1* fits (mean ± standard deviation throughout ROI from subject #1 at 7T and subject #2 at 3T). The solid black line represents the T1L used as input to the simulations, and the red dashed lines are T1* fits to simulated data with the same minimum TI and number of TIs (mean ± standard deviation over 5000 repetitions). (c, d) Simulated mean deviation T1L − T1*, variance σ2 in the fitted T1* values, and MSE = (T1L − T1*)2 + σ2 as a function of minimum TI at 7T (c) and 3T (d). Mean and variance were measured over 5000 Monte Carlo repetitions with 2% noise added to the data. The optimal TI for each field strength is marked with an asterisk.

