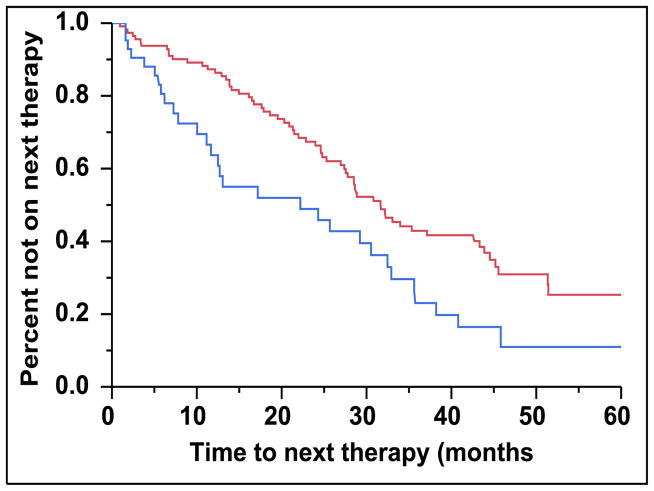
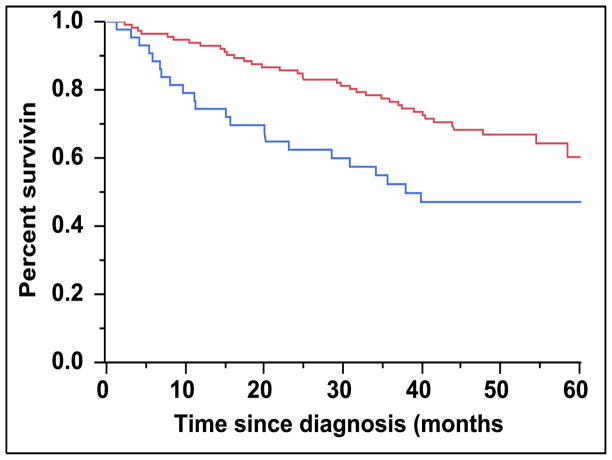
Figure 2.
A: Kaplan-Meier plot comparing TTNT between patients with newly diagnosed MM based on the proportion of CD45 expression on the clonal PCs in the bone marrow. B: Kaplan-Meier plot comparing OS between patients with newly diagnosed MM based on the proportion of CD45 expression on the clonal PCs in the bone marrow.


