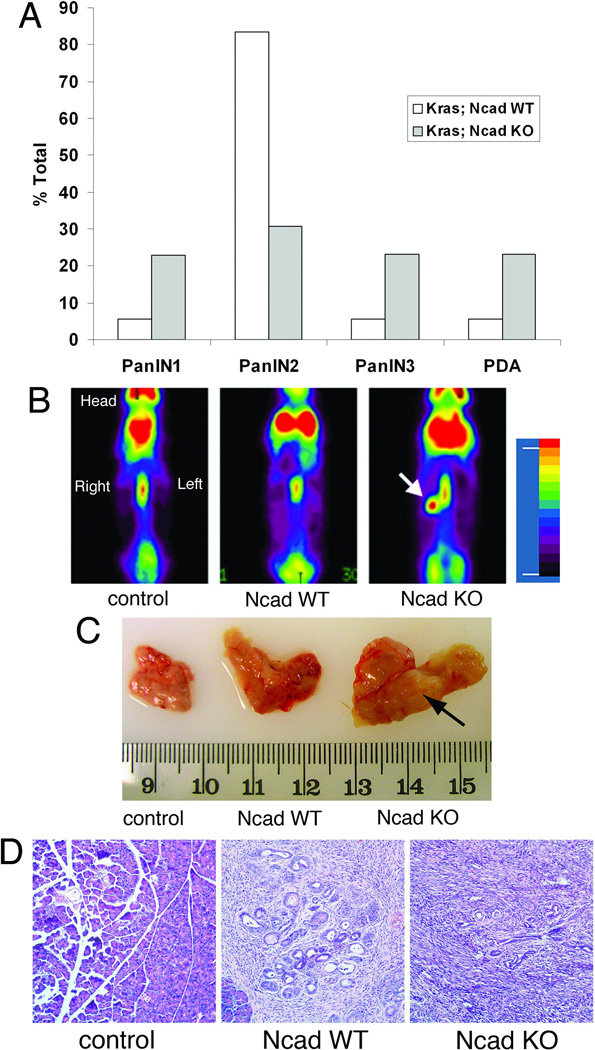
Figure 3. Accelerated mPanIN and tumor development in Ncad KO KC mice.
(A) Quantification of mPanIN and PDA in 8- to 12-month old Ncad KO (n=26) and WT (n=18) mice. Percent (%) total indicates the ratio of mice that developed mPanIN (highest grade counted) or PDA to the total number of mice. An experienced pancreatic pathologist (CS) reviewed tissue specimens in a blinded fashion. Chi-square analysis showed a significant difference between Ncad KO and Ncad WT KC mice (p < 0.05). (B) Whole-body PET scan using 18F-FDG (Fludeoxyglucose (18F)) on 8-month old control, Ncad WT, and Ncad KO mice. Strong uptake of 18F-FDG was observed in the pancreatic region of Ncad KO mouse (arrow) and absent from control and Ncad WT mice. (C) Whole mount images of the pancreata removed from the PET imaged mice (B). A solid mass was found in the pancreas (arrow) of Ncad KO mouse consistent with PET image. (D) Histological analysis of the pancreata confirmed carcinoma in the Ncad KO and mPanIN in the Ncad WT.

