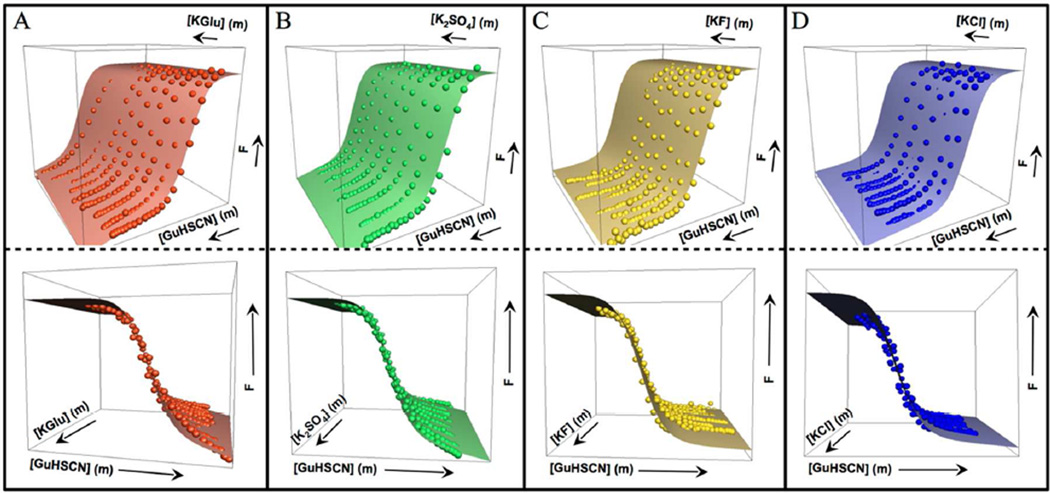
Fig 3.
Normalized fluorescence intensity F of NTL9 Y25 in NB at 20 °C as a function of molal concentrations of GuHSCN and K+ salt: (A) KGlu (red), (B) K2SO4 (green), (C) KF (yellow) and (D) KCl (blue). Each surface shows the global fit (Eq. 8) to the data points (●); top and bottom panels show different views of the fit. K+ salt concentration ranges in panels A, C and D are 0 to 1.5 m; the K2SO4 range (B) is from 0 to 0.5 m. The GuHSCN concentration range in all cases is from 0 to 6 m.

