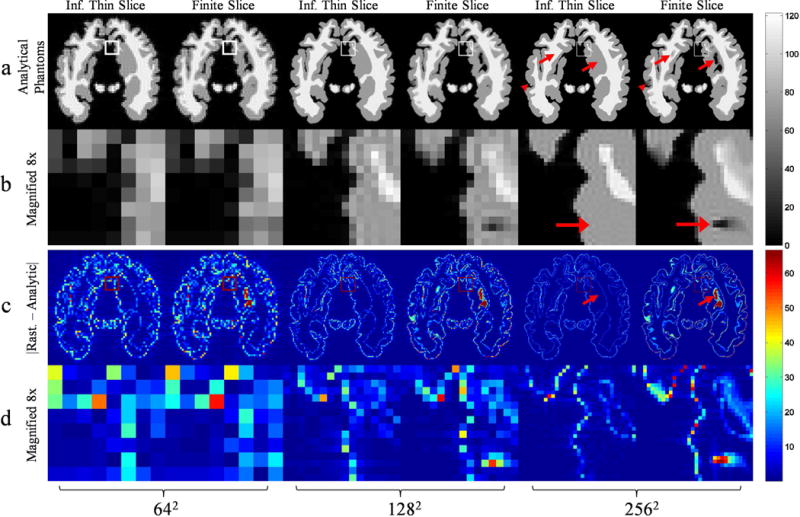
Figure 8.

A comparison of a simulated 2D MRI brain acquisition using an analytical polyhedral phantom with infinitesimally thin and finite thickness slice selection for matrix sizes 642, 1282, and 2562. All images in the rows a, b have the same intensity scaling given by the color bar on the right and similarly with images in rows c, d. For each set of two columns, the left and right correspond to thin and finite thickness slice selection respectively. The arrowheads and full arrows highlight partial volume effects at the edges and in the interior respectively. Row a) IDFT reconstruction of ideal and finite slice simulations. Row b) A magnified section corresponding to the region outlined by boundary pixels in row a. The boundary pixels become proportionately smaller as a side effect of increasing matrix size. Row c) The magnitude of the difference between a rasterized simulation, not shown, generated from the infinitesimally thin slice selection contours and the analytical simulations. The rasterized simulation image matrix is the same size as the k-space matrix used for analytical phantoms. Row d) A magnified section corresponding to the region outlined by boundary pixels in row c, which is the same region outlined in row a) and magnified in row b).
