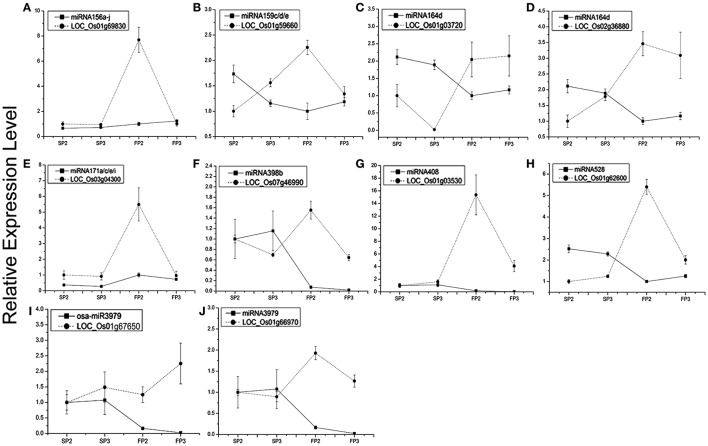
Figure 5.
Expression profiling analysis of several miRNAs and their corresponding target genes. Actin was used as a reference for the target genes. The error bars indicate the standard deviation of three replicates. (A) miRNA156a-j and its target LOC_Os01g69830. (B) miR159c/d/e and its target LOC_Os01g59660. (C) miR164d and its target LOC_Os01g03720. (D) miR164d and its target LOC_Os02g36880. (E) miR171a/c/e/i and its target LOC_Os03g04300. (F) miR398b and its target LOC_Os07g46990. (G) miRNA408 and its target LOC_Os01g03530. (H) miR528 and its target LOC_Os01g62600. (I) miR3979 and its targets LOC_Os01g67650. (J) miR3979 and its target LOC_Os01g66970.

